RTView® Enterprise Edition is an end-to-end monitoring platform that uses Solution Packages to gather and process performance metrics from a wide variety of different technologies.
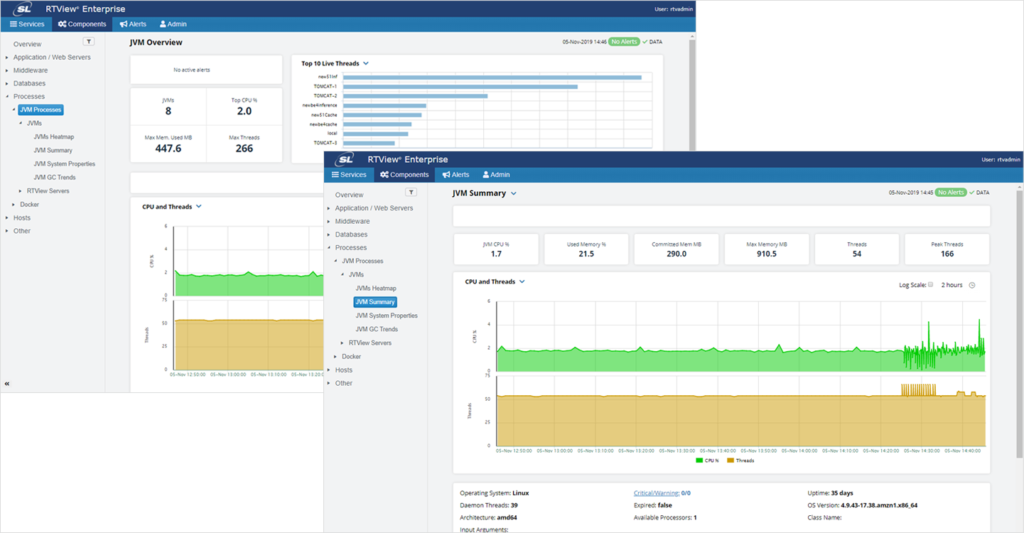
The Solution Package for JVM helps monitor a Java Virtual Machine’s memory heap, non-heap memory, monitor threads and other key metrics to ensure the JVM has good performance. Detailed metrics including JVM CPU usage, Max Heap, Current Heap, Used Heap and Live Threads can all be tracked over time.
The Solution Package for JVM also tracks garbage collection information and trends, including memory usage before and after garbage collection, duration and duty cycles. This, combined with tracking of JVM memory pool trends, enables users to be notified of memory leaks, unusual garbage collection activities and CPU and memory resource issues automatically with minimal user analysis, speeding the discovery of the root cause of any issue.
The RTView Historian enables all JVM metrics to be archived and leveraged for historical analysis and alerting against defined thresholds.
Get all the latest news and updates from RTView
Don’t worry you can unsubscribe at any time!
How is RTView a game-changer for your business?
RTView is the world’s highest performance and lowest
overhead solution designed specifically for
middleware monitoring.
These companies trust RTView TIBCO Monitoring®. You can too!






Need more answers?
Send us a message


