Databases are part of any modern application infrastructure and performance bottlenecks here can impact middleware and other application infrastructure if not caught and addressed early. RTView provides a robust Solution Package for Microsoft SQL Server to provide correlated mssql monitoring for all middleware-powered applications.
All Servers View
RTView provides both a heatmap and tabular view that provides a list of all of your servers and their associated metric data including instance, alert severity, alert count, and the current value of each gathered metric.
Metrics include:
- Alert Level/Alert Count
- Expired Engines
- Active Connections
- CPU Utilization
- Data Received / Sent
- Delta IO Errors/Reads/Writes
- Delta Packet Errors
- Memory Used/Remaining
- Total Database Size
Single SQL Server Views
RTView provides a number of different pre-built dashboards for examining mssql server performance, including:
MSSQL Server Summary
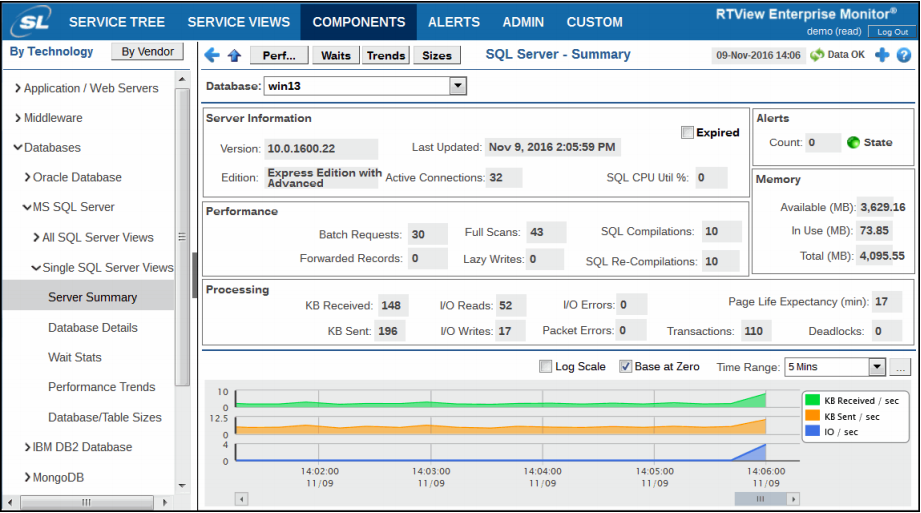
This display allows you to view connection and CPU utilization details, memory statistics, various performance and processing metrics, and trending data for the number of kilobytes received and sent as well as input/output details per second for a particular SQL database server.
MSSQL Database Details
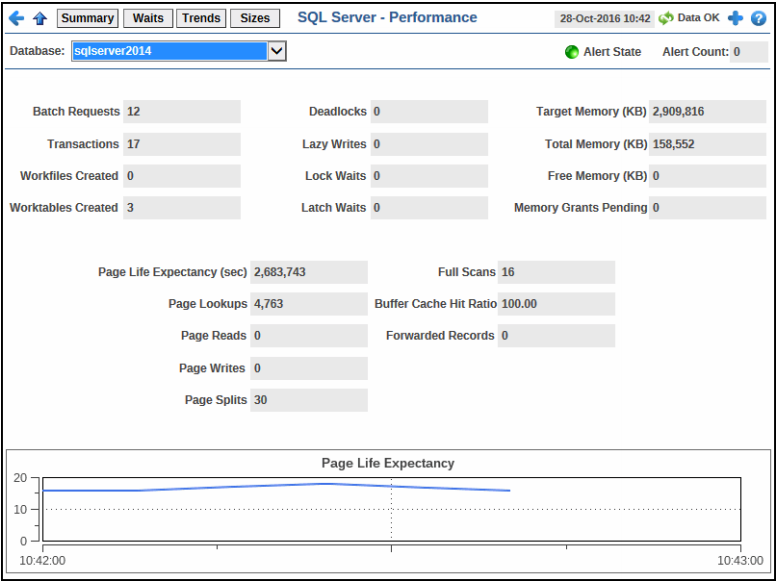
This display allows you to view various database details as well as trending data for the page life expectancy.
MSSQL Wait Stats
This display allows you to view server wait time details in a table format for a particular database server. You can drill-down and view the details for a particular container in the “Server Summary” display by clicking on a row in the resulting table.
MSSQL Performance Trends
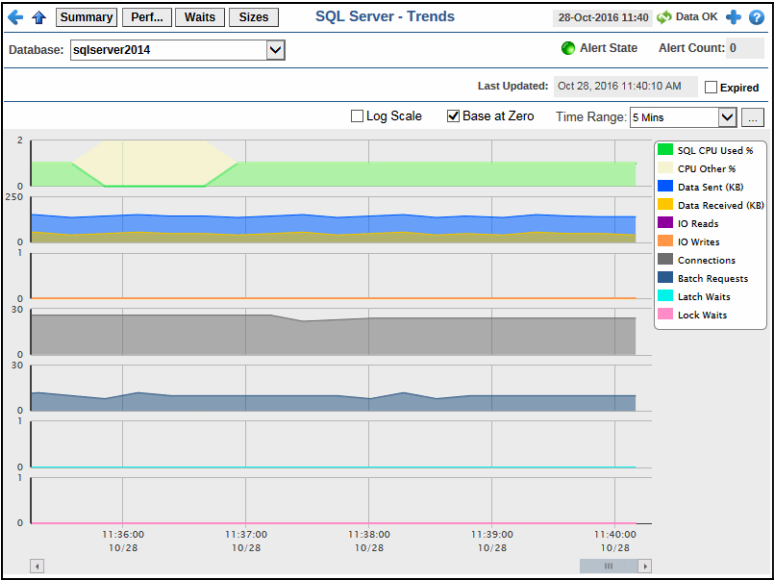
This display traces the current and historical percentage of CPU used by the MS SQL Server, the remainder CPU used in other operations, the amount of data sent, the amount of data received, the number of input/output operation reads, the number of input/output operation writes, the number of connections, the number of batch requests, the number of latch waits, and the number of lock waits for a particular SQL database server.
Database/Table Sizes
This display provides database and table size data for a particular SQL database server.
Centralized Alerting
RTView provides centralized alerting for MSSQL Servers and other related infrastructure for middleware-powered applications or can be integrated with ticketing systems like Service Now.
Alert Administration
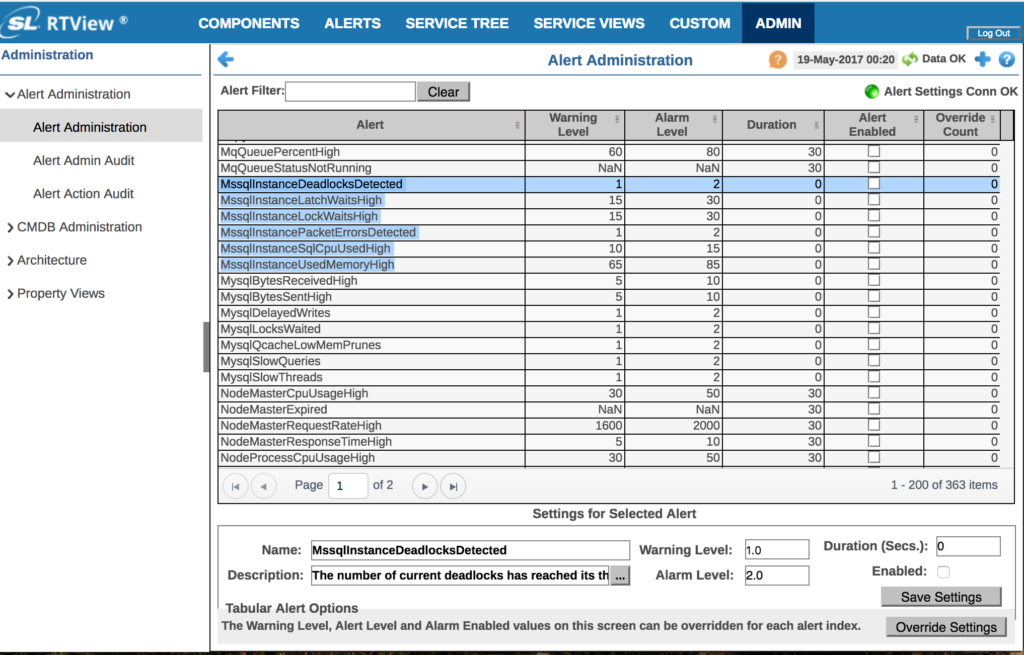
RTView’s Solution Package for Microsoft SQL Server comes with a pre-defined list of alerts and alert parameters, enabling you to get up and running quickly. Enable any of these or create your own. Customize thresholds globally or by exception.
Default Alerts:
- Deadlocks Detected
- Latch Waits High
- Lock Waits High
- Packet Errors Detected
- CPU Used High
- Used Memory High
Get all the latest news and updates from RTView
Don’t worry you can unsubscribe at any time!
These companies trust RTView Kafka Monitoring®. You can too!


How is RTView a game-changer for your business?
RTView is the world’s highest performance and lowest
overhead solution designed specifically for
middleware monitoring.
Need more answers?
Send us a message


