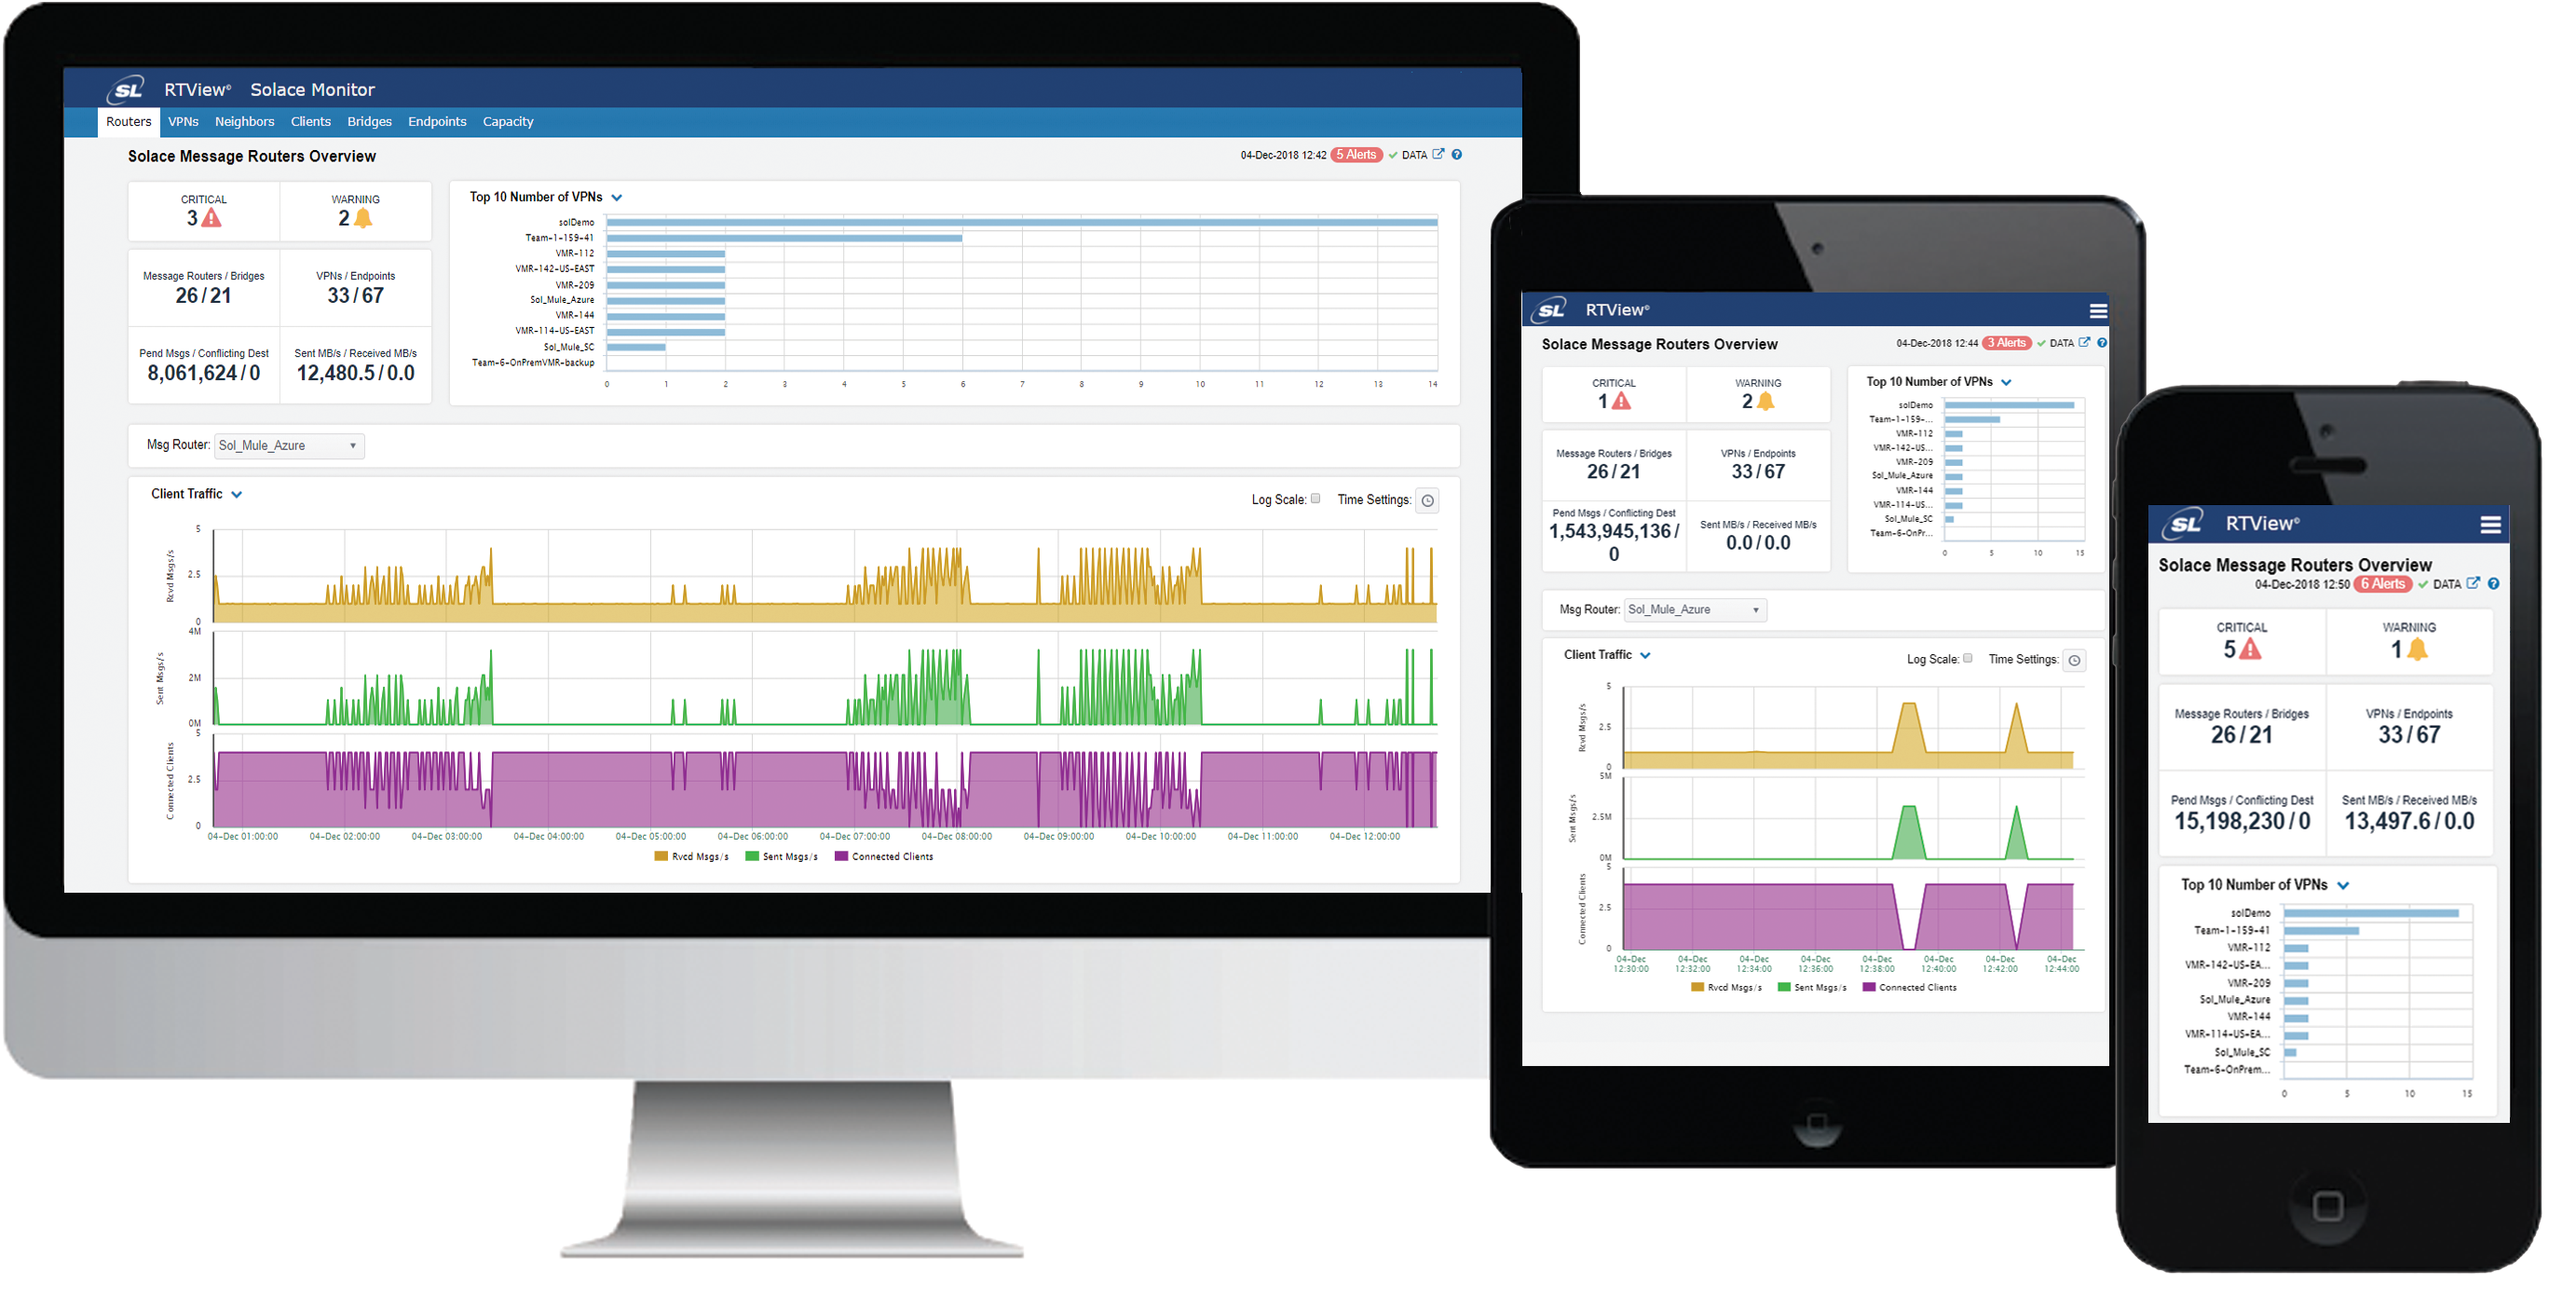
The Solution Package for MySQL Database enables MySQLDB users to continually assess and analyze the health and performance of their infrastructure, gain early warning of issues with historical context, and effectively plan for capacity of their messaging system. It does so by aggregating and analyzing key performance metrics across all instances, databases, and collections, and presents the results, in real time, through meaningful dashboards as data is collected.
ALL MYSQL DATABASES
View all your MySQL databases in one place for fast and easy monitoring.
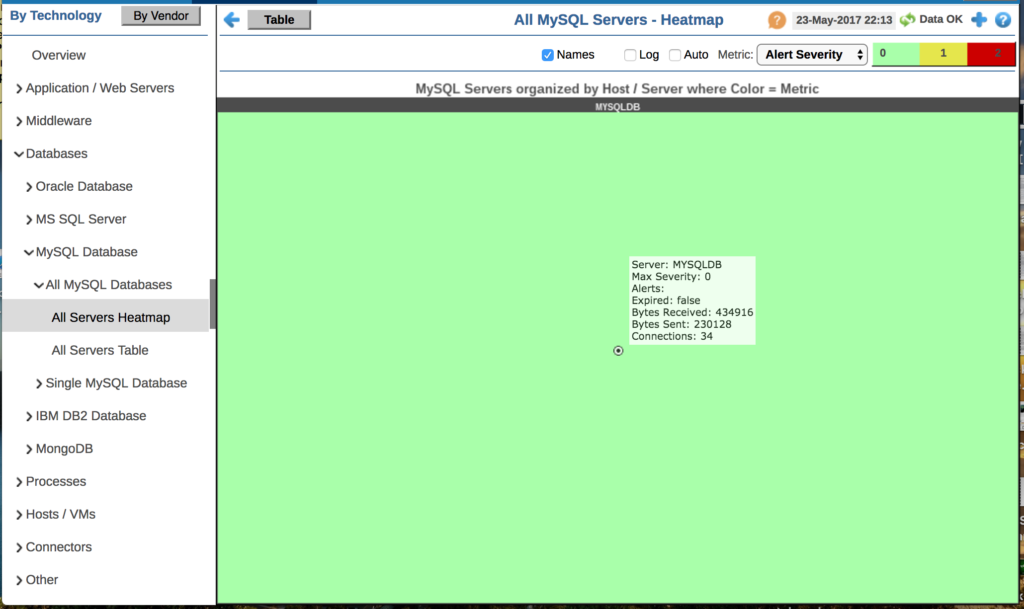
ALL SERVERS HEATMAP
This heatmap display provides an easy-to-view interface that allows you to quickly identify the current status of each of your servers for each available metric. By default, this display shows the heatmap based on the Alert Severity metric.
Heatmap metrics: alert severity, alert count, received,

sent, delayed writes, table locks waited, slow queries,

slow launch threads, Qcache low mem prunes
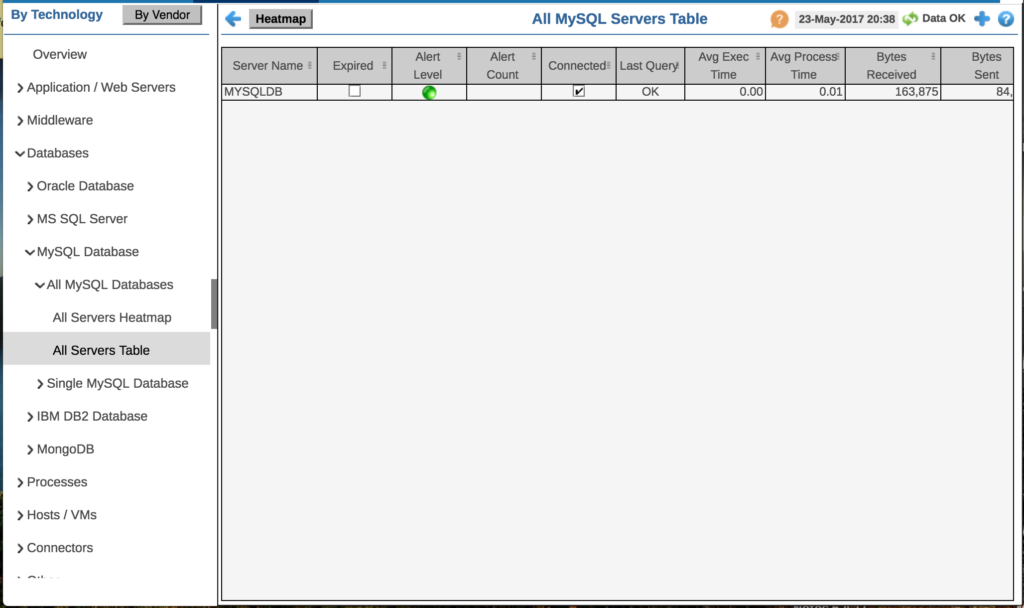
ALL SERVERS TABLE
This display provides a tabular view of the performance metrics shown in the “All Servers Heatmap” (alert level, alert count, bytes received, and so forth), as well as additional metrics (such as query information and uptime). Each table row is a different server. Click a column header to sort column data in numerical or alphabetical order, and drill-down and investigate by clicking a row to view details for a server in the “Server Summary” display.
Each table row is a different server. Click a column header to sort column data in numerical or alphabetical order, and drill-down and investigate by clicking a row to view details for a server in the “Server Summary” display.
Metrics: alerts, connected, last query, avg exec time, avg process time, bytes received, bytes sent, connections, delayed writes, queries, query objects, slow queries, total executions, uptime, concurrent, enabled
ALL MYSQL DATABASES
View all your MySQL databases in one place for fast and easy monitoring.
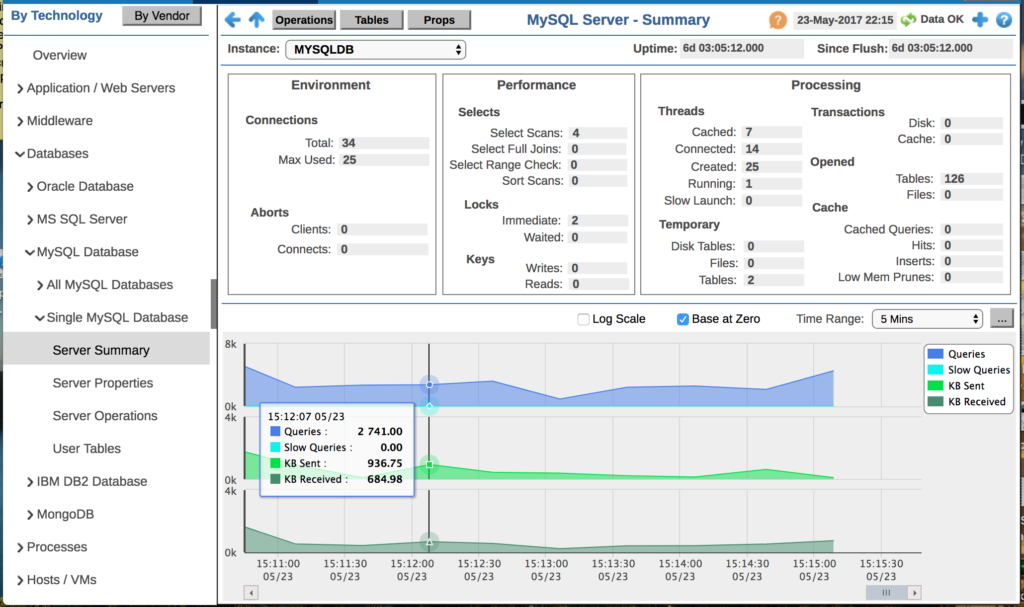
SERVER SUMMARY
View connection, performance and processing details for a single MySQL database server, as well as trending data for the number of kilobytes received and queries. Choose an instance from the Instance drop-down menu. Mouse over the trend graph to see performance metrics with time stamps.
Metrics: connections, aborts, selects, locks, keys, threads, temporary, transactions, opened, cache, queries, slow queries, kb sent, kb received
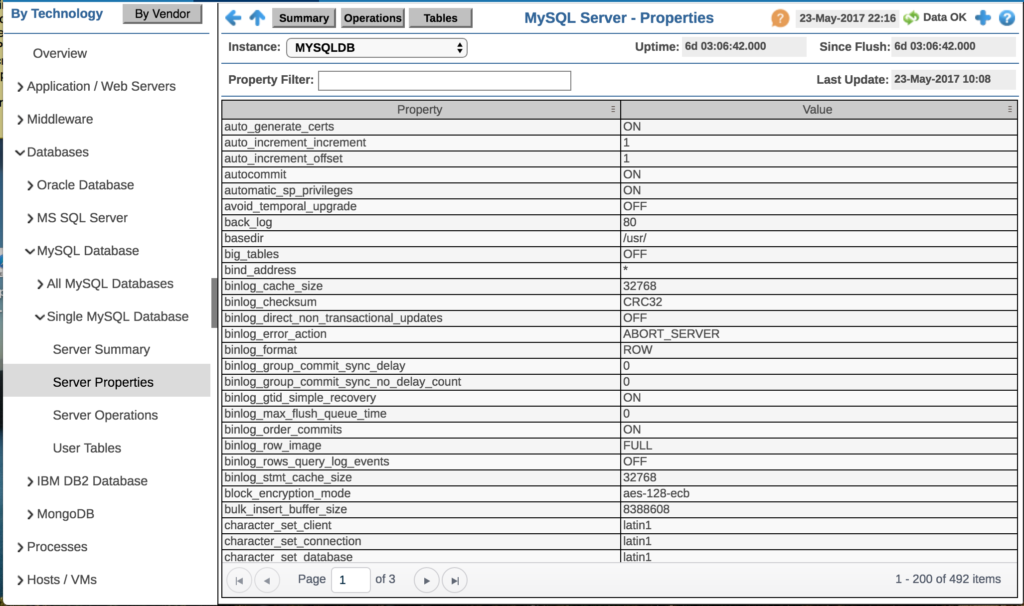
SERVER PROPERTIES
View properties and property values for a single MySQL database server.
Choose an instance from the Instance drop-down menu. Each table row is a different property for the selected instance. Enter a search string in the Property Filter field to limit the number of table rows. Click a column header to sort column data in numerical or alphabetical order.
over 490 server properties available
SERVER OPERATIONS
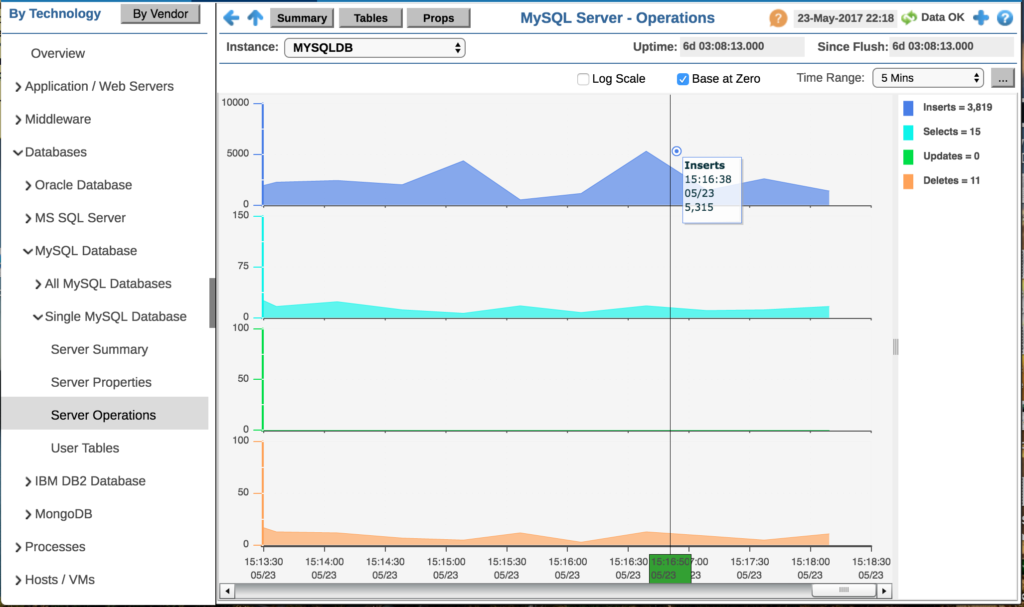
View trending performance data for a single MySQL database server: Inserts, Selects, Updates and Deletes. Choose an instance from the Instance drop-down menu. Mouse over the trend graph to see performance metrics with time stamps.
Metrics: inserts, selects, updates, deletes
SERVER OPERATIONS
View trending performance data for a single MySQL database server: Inserts, Selects, Updates and Deletes. Choose an instance from the Instance drop-down menu. Mouse over the trend graph to see performance metrics with time stamps.
Metrics: inserts, selects, updates, deletes
USER TABLES
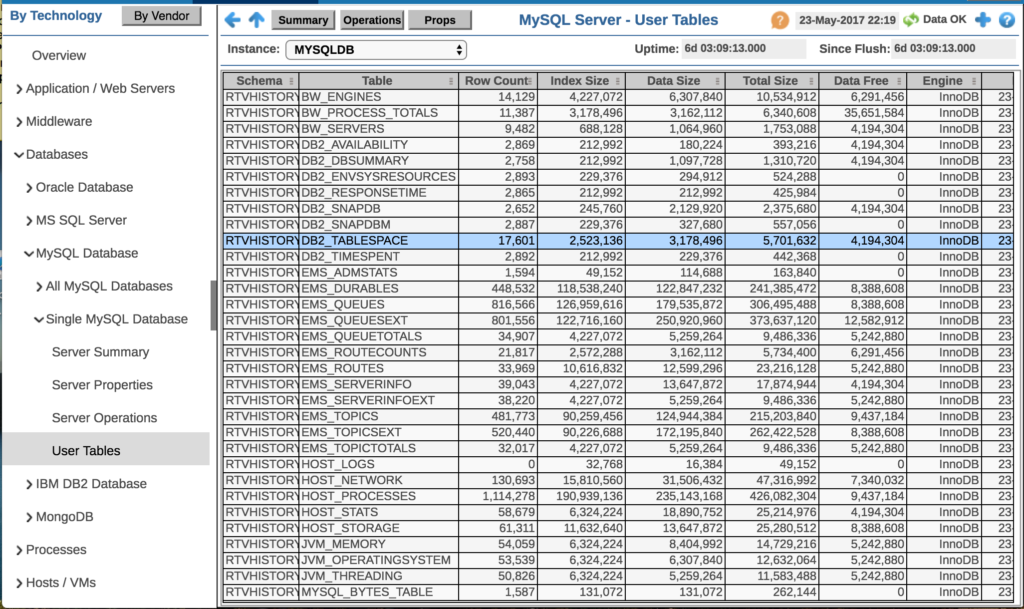
View performance and utilization details for cache tables for a single MySQL database server. Each row is a different cache table. Choose an instance from the Instance drop-down menu. Click a column header to sort column data in numerical or alphabetical order.
Metrics: schema, table, row count, index size, data size, total size, data free, engine
REAL-TIME ALERTS
Get real-time alerts sent directly to your inbox or text message. RTView comes with pre-built alerts and pre-configured thresholds out-of-the-box to get you up and running quickly.
ALERT ADMINISTRATION
Use RTViews pre-defined alerts with the pre-configured thresholds or create your own. Manage through RTView or export to ServiceNow or several other ticket management systems.
Alerts: MssqlInstanceDeadlocksDetected

MssqlInstanceLatchWaitsHigh

MssqlInstanceLockWaitsHigh

MssqlInstancePacketErrors

MssqlInstanceSqlCpuUsedHigh

MssqlInstanceUsedMemoryHigh

MysqlBytesReceivedHigh

MysqlBytesSentHigh

MysqlDelayedWrites

MysqlLocksWaited

MysqlQcacheLowMemPrunes

MysqlSlowQueries

MysqlSlowThreads
Get all the latest news and updates from RTView
Don’t worry you can unsubscribe at any time!
These companies trust RTView Kafka Monitoring®. You can too!


How is RTView a game-changer for your business?
RTView is the world’s highest performance and lowest
overhead solution designed specifically for
middleware monitoring.
Need more answers?
Send us a message


