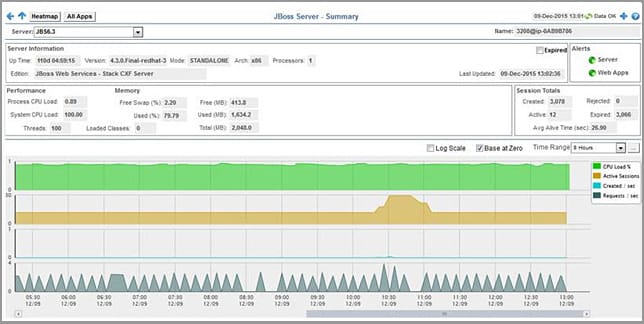
Gain real-time insight into JBoss performance and resource utilization and the performance impact on adjacent middleware technologies by moving from reactive monitoring to proactive monitoring, where you are able to identify potential problems before they become critical and impact overall application performance. Typical installations of RTView® Enterprise Edition and its Solution Packages take only a few hours, while developing custom views for a variety of IT and development roles can be achieved in just days.
Gain real-time insight into JBoss performance and resource utilization and the performance impact on adjacent middleware technologies by moving from reactive monitoring to proactive monitoring, where you are able to identify potential problems before they become critical and impact overall application performance. Typical installations of RTView® Enterprise Edition and its Solution Packages take only a few hours, while developing custom views for a variety of IT and development roles can be achieved in just days.
Key Features
- Monitor real-time performance for early warning
- Analyze historical performance to differentiate trends and spikes
- Out of the box discovery and monitoring of key metrics and resources
- Powerful diagnostics and correlations for complex performance analysis
- View JBoss in an application context
- Instant insight for JBoss resource management
- Application-centric monitoring of JBoss operations
- Minimal training, highly configurable by business and technical users
Metrics for JBoss JVMs
- Server Information for easy identification
– Uptime, Version, Mode, Arch, Processors, Edition, Last Updated - Performance metrics
-Process & System CPU Load
-Thread Usage & Loaded Classes - Memory Usage (% and MB)
-Swap / Free / Used / Total - Session Totals and Rates
-Created / Rejected / Active / Expired / Avg. Alive Time - Alert Status / Level
-Server & Web Apps
-Alert Impact, Alert Severity, Alert Count and Criticality - Performance Time-series
-Displayable with configurable time ranges (Add data, 2 mins, 5 mins, 20 mins, 1 hour, 2 hours, 4 hours, 8 hours, 24 hours, 2 days, 7 days - Prebuilt Displays
-All Servers Heatmap, Table & Individual Server Summary
-Applications Heatmap, Table and Applications Summary
End-to-End Context for JBoss
- Custom flow diagrams help visualize complex applications and JBoss’s place in that architecture
- Troubleshoot bottlenecks between app server and middleware messaging
- Provides an Intuitive View of How JBoss Interacts with other Enterprise PaaS Components
- Designed and Developed for Large Scale, Mission Critical Environments
Get all the latest news and updates from RTView
Don’t worry you can unsubscribe at any time!
How is RTView a game-changer for your business?
RTView is the world’s highest performance and lowest
overhead solution designed specifically for
middleware monitoring.
These companies trust RTView TIBCO Monitoring®. You can too!






Need more answers?
Send us a message
