Apache Kafka Monitoring with RTView®
Kafka Monitoring within Complex Kafka Environments
Kafka Monitoring within Complex Kafka Environments

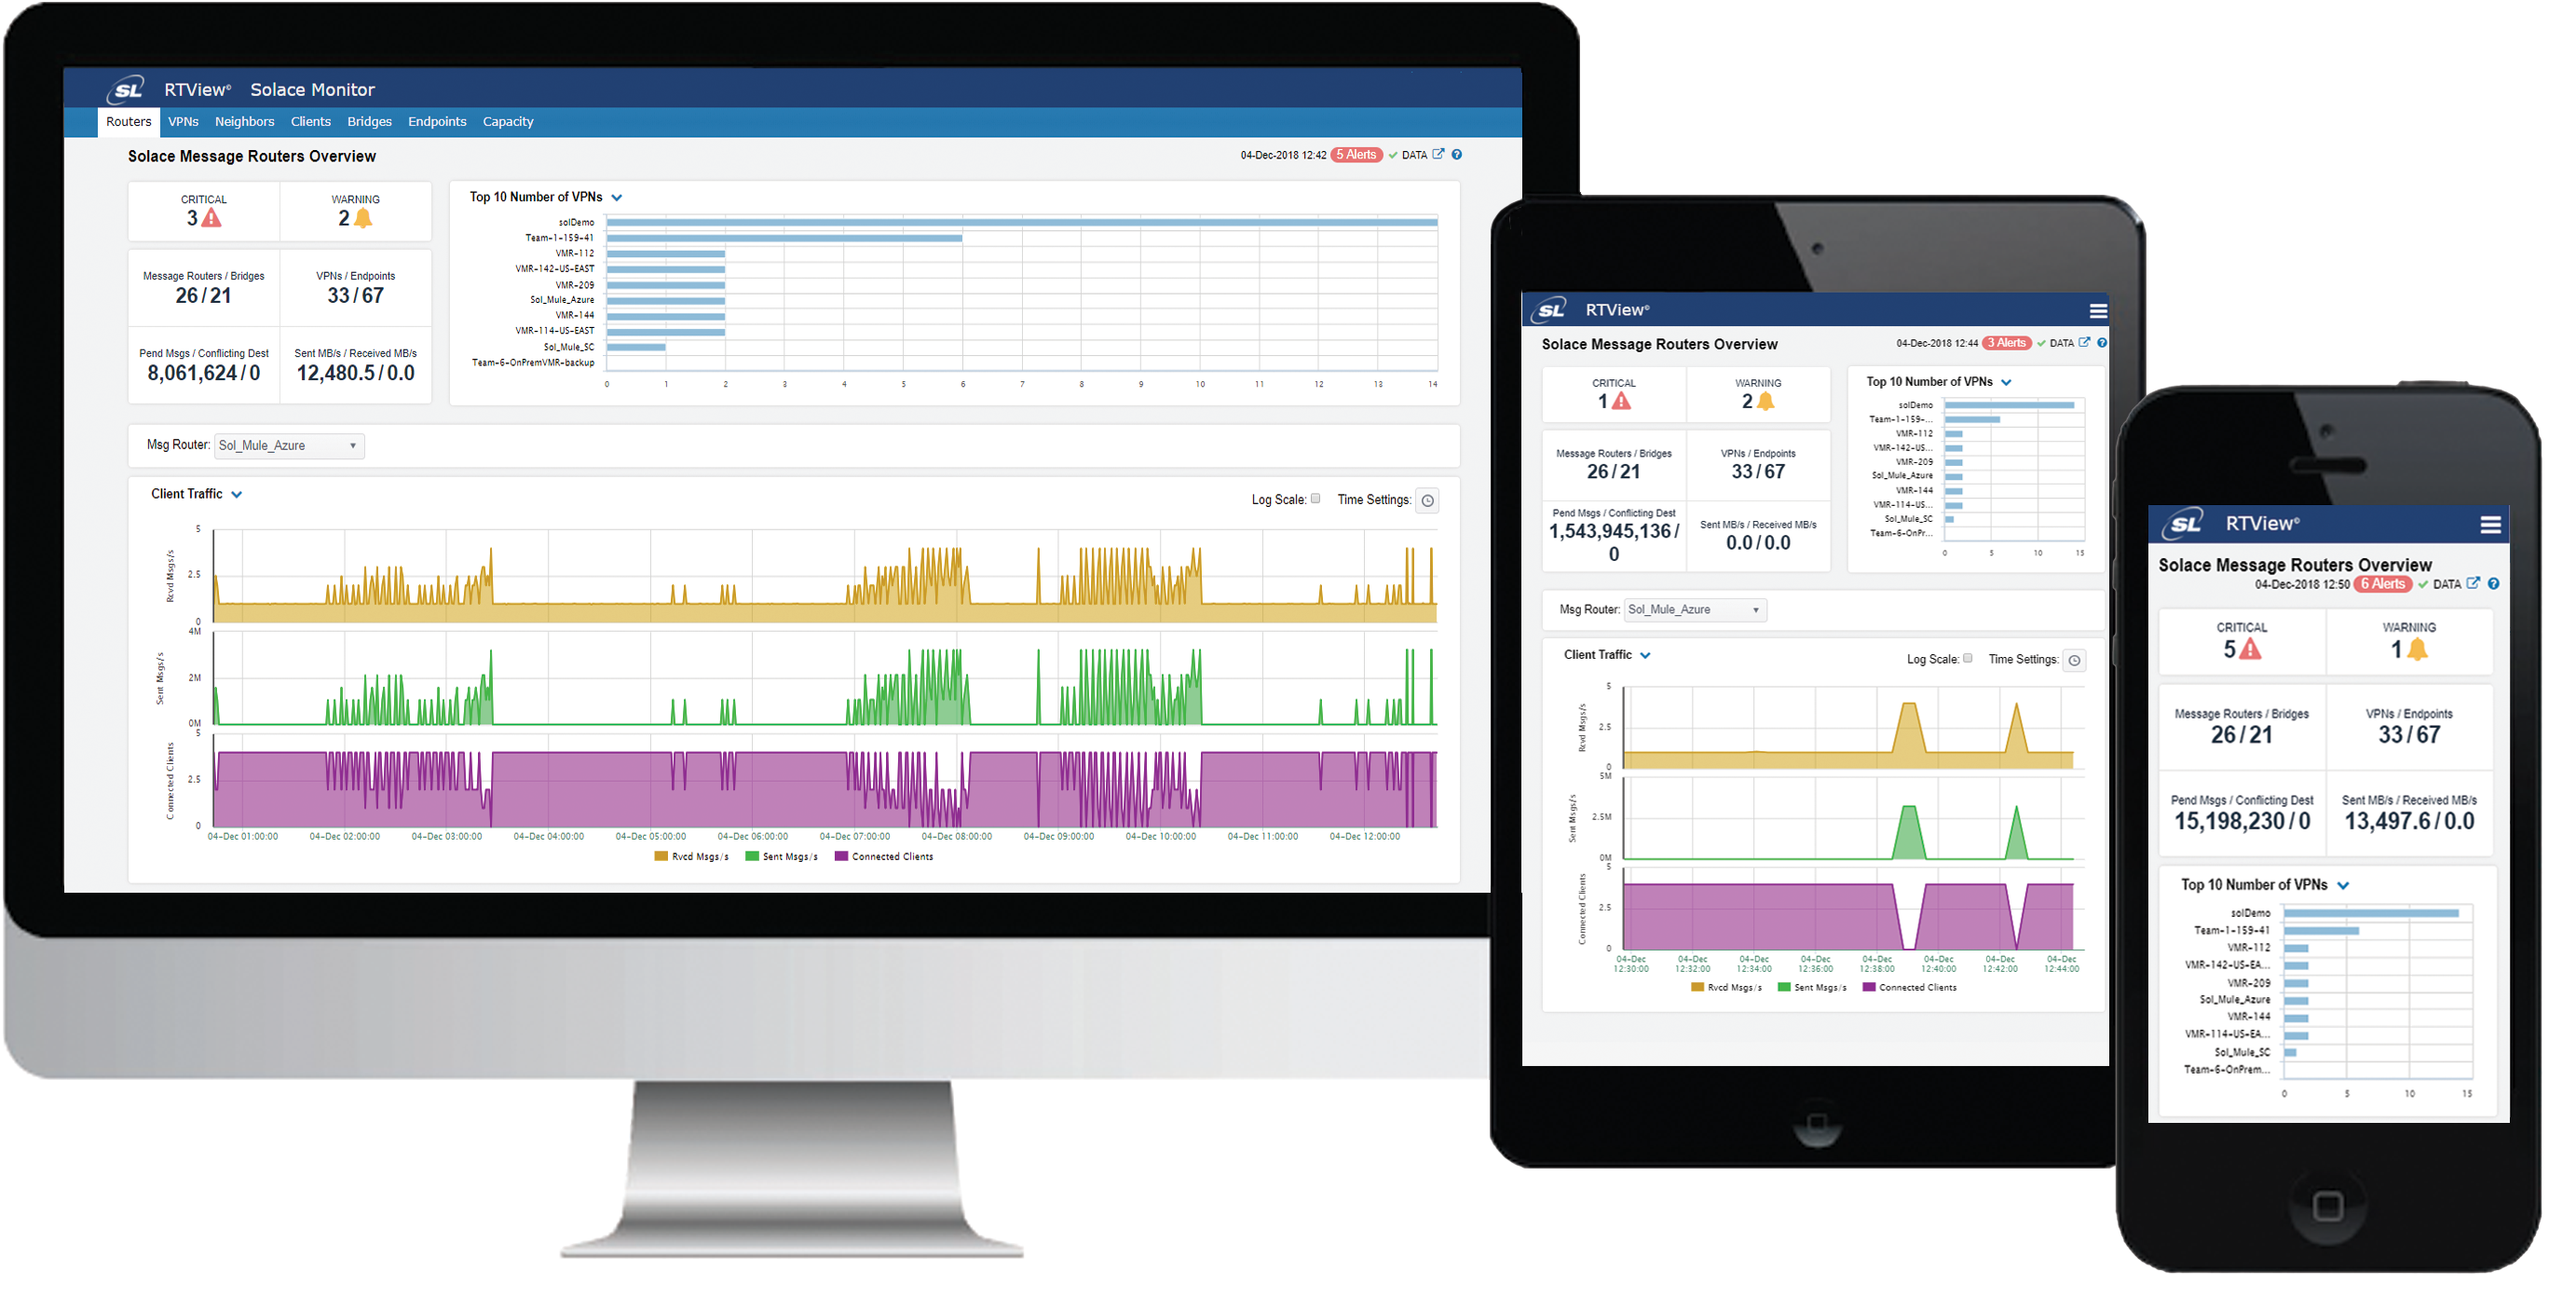
RTView’s Solution Package for Apache Kafka provides a complete Kafka monitoring solution with pre-built dashboards for monitoring Kafka brokers, producers, consumers, topics, and Kafka Zookeepers. With over 30 pre-defined alerts and over 15 pre-built monitoring dashboards, users can deploy quickly without the time, skill and expense necessary to build or configure their own monitoring applications or dashboards.
The Solution Package for Kafka can be used to provide a Kafka-only monitor or within a larger RTView Enterprise Edition system that also provides visibility into the complementary technologies that make up a Kafka-based service or application. This enables users to cross-correlate and perform root cause analysis across the entire application stack for different types of components, including middleware (Kafka, TIBCO, Solace), databases, VMware, and open source, from the host and network level through the database and middleware layers up to the application itself. And RTView can centralize all this across on-premise, cloud-based, and hybrid environments.
RTView® Enterprise Edition is a platform inside which any number of solution packages can be hosted, aggregating component-level data and viewing/managing/correlating these data as a whole. Without RTView® Enterprise Edition, users would be able to view only each individual data source, albeit with advanced visualizations and real-time granularity, but without the ability to aggregate and compare critical event data across all the relevant components of an enterprise deployment environment.
RTView® Enterprise Edition enables direct or indirect collection of data at the Solution Package level. Solution Packages are available for multiple off-the-shelf components across all of the tiers in common deployment architectures, including infrastructure (hardware, OS, network, storage, and database), middleware (app servers, data grids, messaging systems, SOA and event processing servers, etc.) and UI/UX components and processes.
Thorough troubleshooting requires that you understand how problems occur and develop so that you can make sure that they don’t happen repeatedly. RTView intelligently caches data in-memory for instant access and data can be stored persistently for long-term capacity analysis.
Our time-series trend charts easily differentiate between transient spikes and slow-growth trends so that users can respond appropriately. Users can access a rich set of historical performance data going back months or even years for troubleshooting and failure analysis.
With RTView Enterprise, users can group application components, such as Kafka brokers and zookeepers, by logical groups. Groups can be defined as applications, services, business units, data centers or other geographical entity and can include a variety of different components from different application tiers such as other middleware or virtual hosts. For application support teams, this capability is critical so they can understand the business criticality of issues to more effectively prioritize and respond to events.
With RTView Enterprise, users can group application components, such as Kafka brokers and zookeepers, by logical groups. Groups can be defined as applications, services, business units, data centers or other geographical entity and can include a variety of different components from different application tiers such as other middleware or virtual hosts. For application support teams, this capability is critical so they can understand the business criticality of issues to more effectively prioritize and respond to events.
RTView provides centralized alert management with pre-defined alerts with pre-configured thresholds out of the box. A number of Kafka alerts are provided including:
Alerts can be centralized and managed from multiple middleware applications and other monitoring systems. Alerts can also be integrated and workflow automated with third-party monitoring and service desk applications such as ServiceNow or Remedy.
