TIBCO Adapters are the critical link between TIBCO processes and the target system, so it is important to ensure that this link is running quickly and smoothly. The RTView Solution Package for TIBCO Adapters gives you visibility into the performance of this critical layer.
TIBCO Adapters are the critical link between TIBCO processes and the target system, so it is important to ensure that this link is running quickly and smoothly. The RTView Solution Package for TIBCO Adapters gives you visibility into the performance of this critical layer.
Monitor All TIBCO Adapters
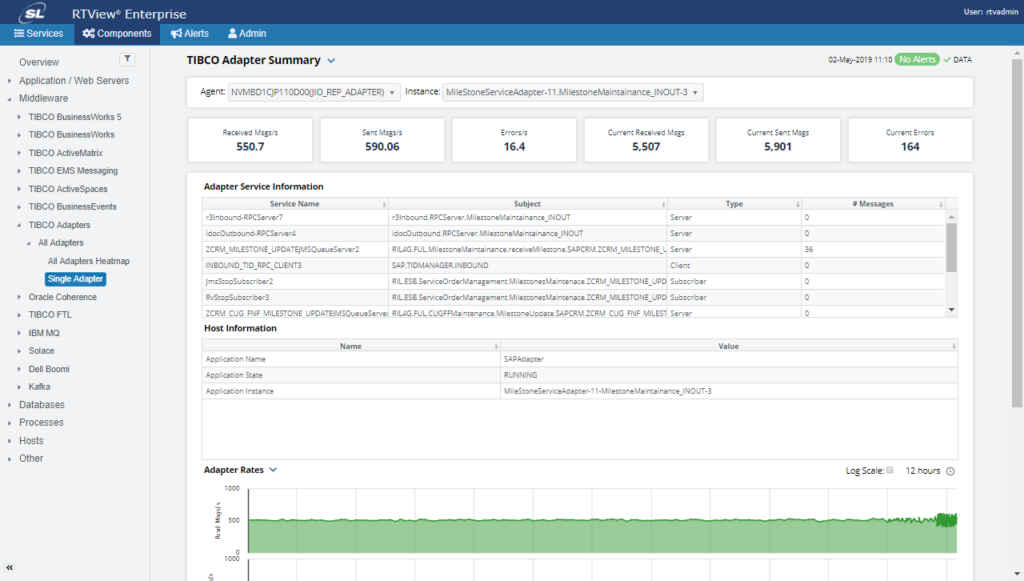
Gain visibility into all of your TIBCO Adapters in one place for easy monitoring and then drill-down into individual adapters if performance problems are detected and need further investigation.
This heatmap display shows quick, at-a-glance status of all TIBCO Adapters. Simply mouse-over a square for more detail and click to drill-down into the Single Adapter Summary. Especially helpful when maintaining a large number of adapters.
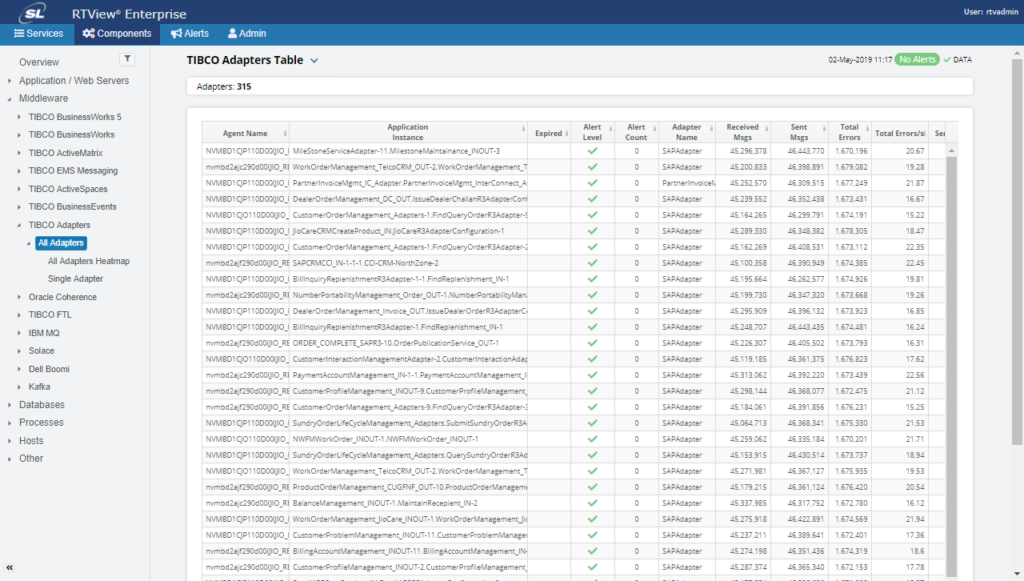
All Adapters Table
This display is often favored by administrators because of the large number of metrics available in the table. Scroll right to see more metrics. Sort and rearrange columns to personalize your experience. Click to drill down to Adapter Summary.
Metrics include:
- Alert Level and Count
- Messages Received (#, delta, rate)
- Messages Sent (#, delta, rate)
- Errors (new, total, delta, rate)
- Uptime
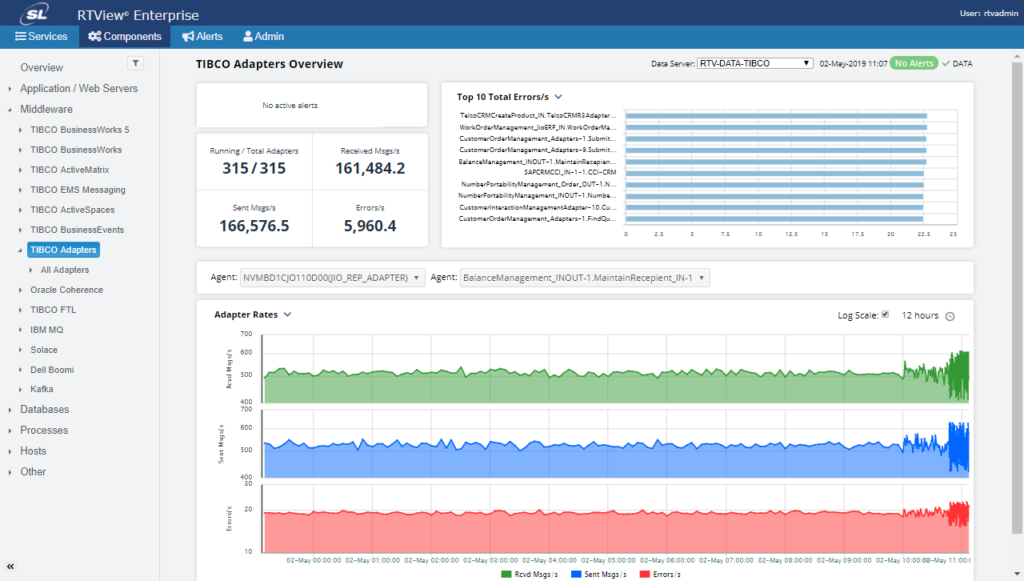
TIBCO Adapters Overview
This display shows key performance metrics across your TIBCO adapter environment. Change the time range to view up user-selectable periods of historical performance to improve troubleshooting and better understand performance trends.
TIBCO Adapters Overview
This display shows key performance metrics across your TIBCO adapter environment. Change the time range to view up user-selectable periods of historical performance to improve troubleshooting and better understand performance trends.
Get all the latest news and updates from RTView
Don’t worry you can unsubscribe at any time!
How is RTView a game-changer for your business?
RTView is the world’s highest performance and lowest
overhead solution designed specifically for
middleware monitoring.
These companies trust RTView TIBCO Monitoring®. You can too!




Need more answers?
Send us a message


