Middleware Monitoring with RTView®
SL solves these problems using these core middleware monitoring capabilities
SL solves these problems using these core middleware monitoring capabilities

You are running up-to-date applications and your databases are optimized. So why are you still experiencing slowdowns and outages with your critical applications? It may be your middleware. Since middleware handles the communication and data management between applications and operating systems, your constantly evolving mix of middleware technologies could be your greatest challenge.
At SL, we help middleware teams more effectively monitor their middleware platforms with an unmatched level of visibility into the performance and health of their systems that is seldom achieved with vendor-built, technology-specific management consoles.
RTView® Enterprise Edition taps into existing monitoring silos, where available, to maximize current investments while providing a single console so users don’t have to bounce between multiple disparate interfaces. See TIBCO Hawk and Oracle Enterprise Manager.
An agentless approach to data collection means no additional performance overhead on your middleware applications and significantly reduces the maintenance costs across massively distributed middleware environments.
Perform regular capacity analysis using historical performance data to ensure that you have enough resources available to support forecasted workload without wasteful over-provisioning.
Customize default views for different teams to see only the platforms you care about and eliminate alert overload.
RTView® Enterprise Edition provides a unique progressive drill-down interface, starting with top-level application health summaries, that drill-down to middleware technology layers and again down to individual instances – allowing front line support teams to quickly identify when and where to escalate support problems to the proper middleware operations teams.
RTView® Enterprise Edition provides a unique progressive drill-down interface, starting with top-level application health summaries, that drill-down to middleware technology layers and again down to individual instances – allowing front line support teams to quickly identify when and where to escalate support problems to the proper middleware operations teams.
Alerts from multiple monitoring technologies can be consolidated into the RTView® Enterprise Edition alert console for easier management and can be easily prioritized based on the defined “criticality score” of the apps and services they support.
Middleware performance is often affected by other environmental components like physical hosts, virtual hosts, databases, message queues, app servers, etc… RTView® Enterprise Edition provides contextual visibility into the other components connected to any middleware instance. Allowing you to see if middleware problems are being caused by external factors.
Root cause analysis is facilitated via historical data collection so you can replay performance metrics that precede health alerts and identify conditions leading up to performance failures. Useful for identifying trends, spikes and regularly recurring conditions. View middleware performance in context with peripheral components over same time period to uncover causal relationships.
RTView® Enterprise Edition employs a distributed architecture to ensure maximum performance and scalability. Real-time data is cached locally and only the data that is needed is streamed to the monitoring console – minimizing network overhead.
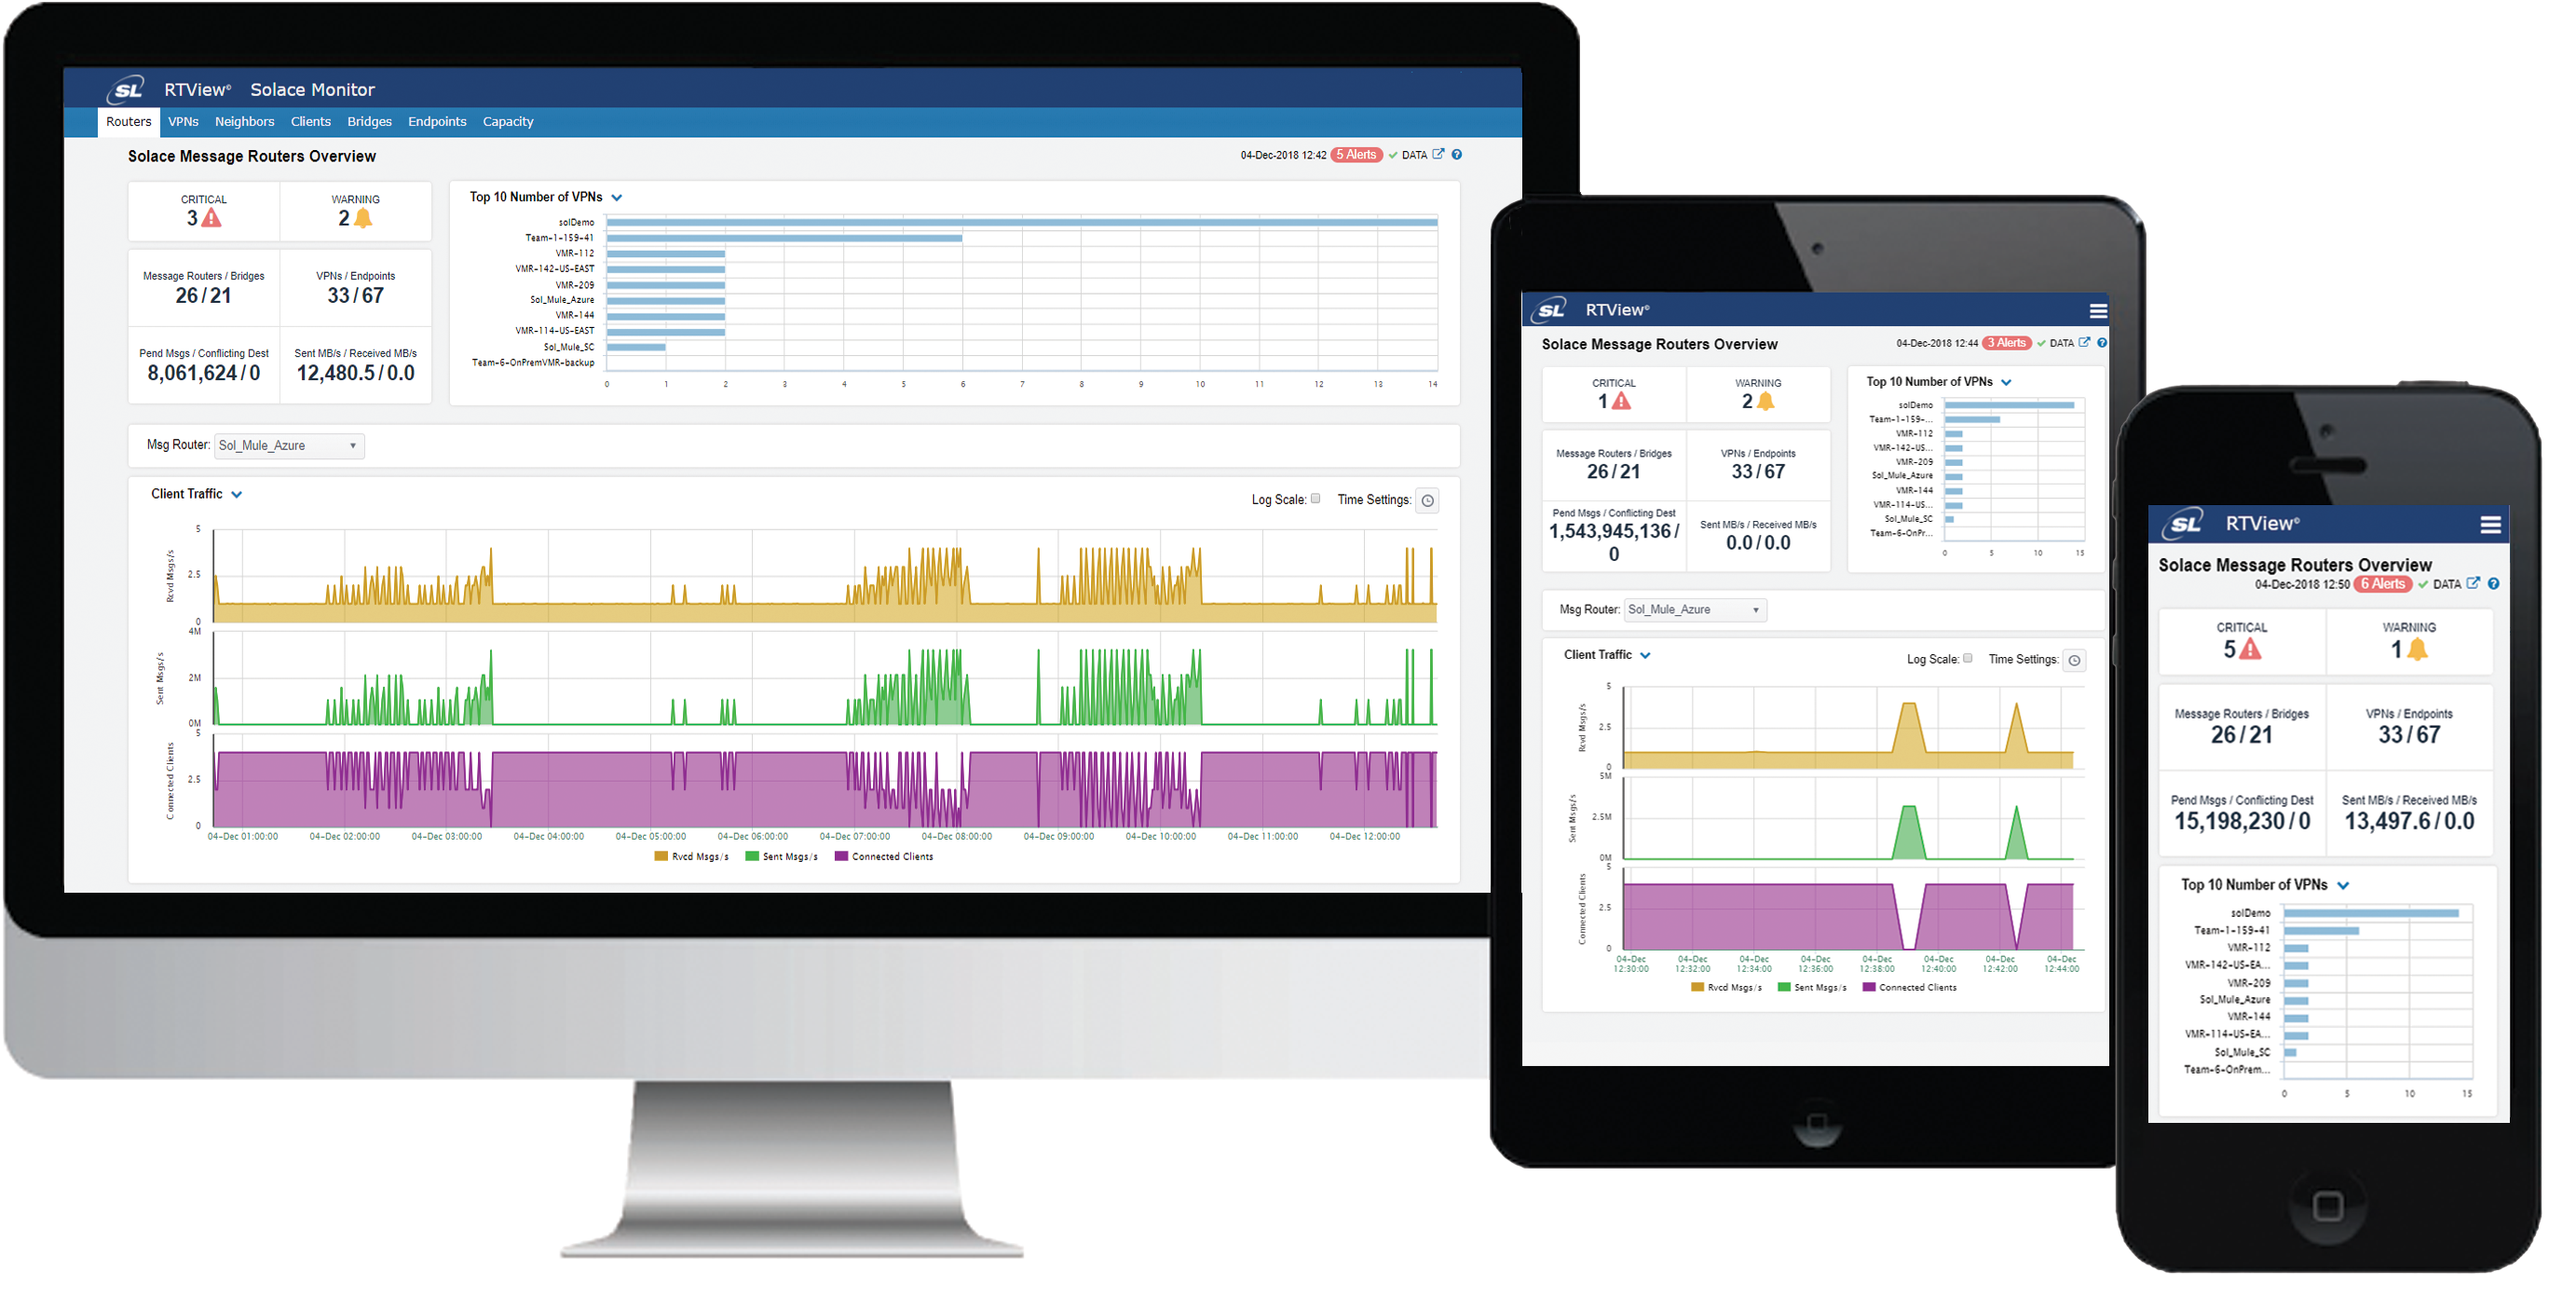
RTView® Enterprise Edition uses solution packages to connect to each middleware technology. Here is a selection of middleware-oriented solution packages available for RTView® Enterprise Edition today.
Messaging:
Solace Message Router
Apache Kafka
IBM MQ
TIBCO Enterprise Message Service
TIBCO FTL
Integration:
BusinessWorks
ActiveSpaces
TIBCO Adapters
Oracle WebLogic
IBM WebSphere
Node.js
Oracle Coherence
Infrastructure:
VMware
Docker
Oracle Database
Microsoft SQL Server
MySQL
MongoDB
IBM DB2
JBoss
Amazon AWS
TIBCO Hawk
