Many organizations have licensed RTView TIBCO middleware monitors through TIBCO, an SL partner. These single technology monitors are built specifically for:
- TIBCO BusinessWorks 5, 6 and Container Edition (CE)
- TIBCO EMS
- TIBCO BusinessEvents
- TIBCO ActiveSpaces 4
each monitoring that particular technology.
Middleware support teams often struggle with visibility into what some refer to as the middleware “black box.” TIBCO offers the RTView TIBCO Monitoring packages to complement and enhance the basic admin tools that come with the middleware technology products. RTView requires minimal configuration and offers many pre-built displays, extensive historical information, pre-configured alerting features, and tools for effectively analyzing key monitoring data.
If you are working with a single middleware technology, this is all well and good. However, this ‘silo’ approach to TIBCO monitoring limits the ability to correlate information across multiple middleware platforms. Most applications are built using a combination of technologies, not just one. This leaves support teams with the task of doing a serial analysis of their infrastructure and middleware during a crisis, something that can be highly ineffective and time-consuming.
Many of our clients have decided that an application-centric vision is critical in day-to-day operations and have upgraded to RTView Enterprise licenses by SL. By providing cross-platform monitoring through the same set of screens and reports, analysis can be conducted in parallel, providing visibility into the interplay between technologies. Your individual RTView monitors essentially serve as plug-ins to the RTView Enterprise platform to provide end-to-end monitoring across your middleware environment. There are several reasons you might choose to do this.
1. Include other TIBCO and non-TIBCO Technologies in a single, consolidated monitoring framework
TIBCO support teams often support several different technologies, some TIBCO and some not TIBCO, such as Apache Kafka. It is generally preferable to use a single tool to centralize TIBCO monitoring and alerting whenever possible. Support teams also realize that they need visibility into the upstream and downstream components other than TIBCO that impact their environment.
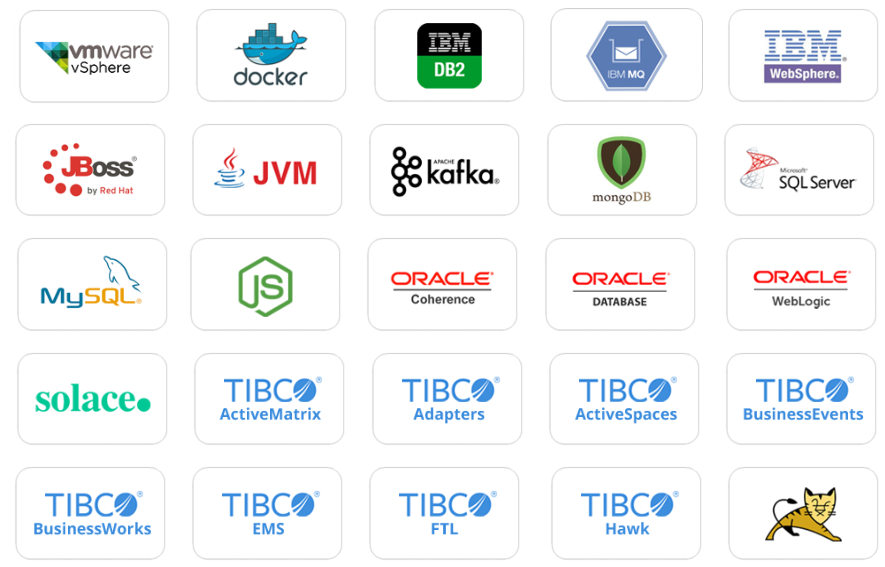
Here is a partial list of supported technologies that can be easily included in your RTView Enterprise system.Click here for a complete list of Solution Packages.
2. Gain Cross-Platform Application-Centric Visibility to Understand the Impact of Middleware Problems
Application teams and development teams are generally organized within application or business service lines, not technology silos. So providing monitoring and alerting that can support these organizational lines is important.
And application teams always want to be more proactive in their monitoring and alerting. One way our users achieve this is with application and service-centric views of their critical applications.
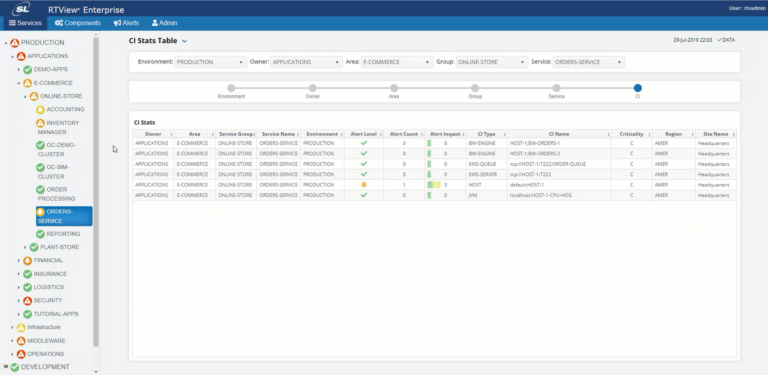 This single service summary displays all of the components used in this service including TIBCO EMS, TIBCO BW, WebLogic, a JVM, and VMware
Service views and alerts enable these teams to better understand dependencies and which technologies and components support a critical business service and if a problem occurs in a service, how that will affect other components used by the service.
This history heatmap display provides visibility into the health of all components supporting a business service, including TIBCO BusinessWorks, TIBCO EMS, an Oracle Database, VMware instances and Hosts.
This enables the support team to correlate how performance issues in one or more components in a service may impact other components.
 This history heatmap shows performance of all components making up a service over a 24 hour period.
3. Make Sense of Large Systems with Logical Groupings
Large and distributed applications can be difficult to understand because of the sheer size. The RTView Enterprise service model allows users to break down these large environments into logical groupings. Groupings may represent applications, service groups, geographic groups, data centers, or any other logical grouping that makes sense for your business.
Seeing the data in this way suggests immediate prioritization of support efforts when multiple incidents arise at the same time.
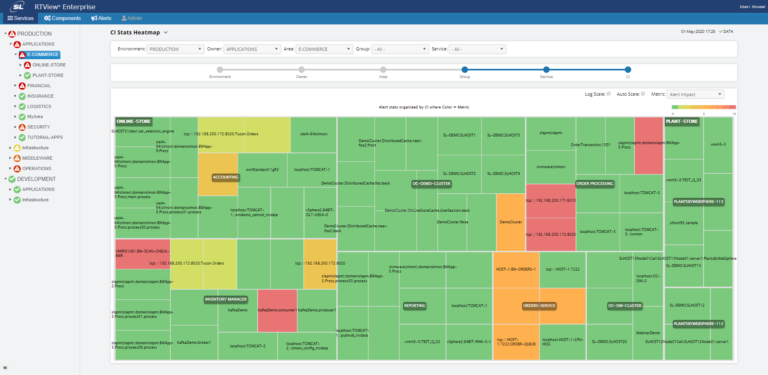 This heatmap provides a real-time health snapshot of all service groups in a large system, making it easy to visually spot issues..
4. Provide Support Teams with Both Component Alerts and Relevant Service-based Alerts
Alerting can be challenging because of the high volume of alerts and the multiple monitoring tool in use in many organizations. As a rule, support teams only want to see the alerts they care about.
RTView Enterprise enables support teams to consolidate their alerts and filter them by application, service, or technology and to understand if a specific alert is impacting an important service. This makes it much easier to prioritize response and maintain critical SLAs.
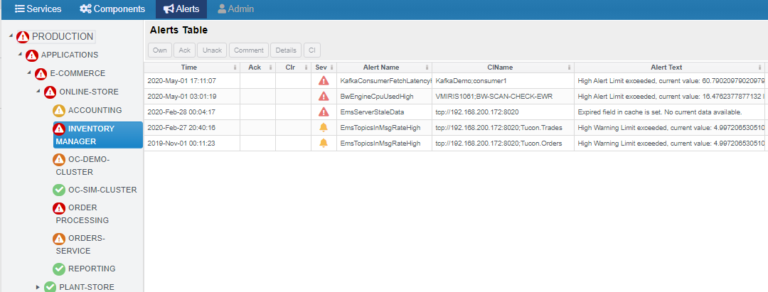 View component alerts in the context of an application or service
5. Role-based Visualization for different roles
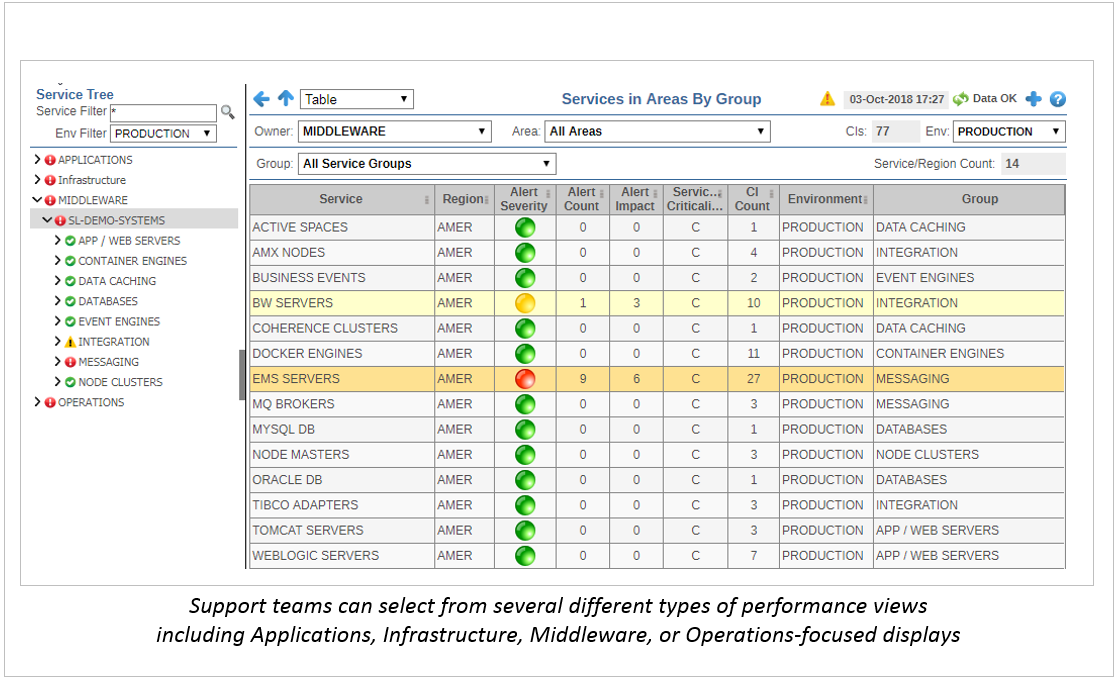 Several different types of service displays are provided to enable different teams to access performance information optimized for their role in the organization.
Data are collected once and then optimized for visualization by team members in different teams such as Application Support, Middleware Support, and Operations — all looking at the same data but in the right context.
6. Application Data Flow Diagrams
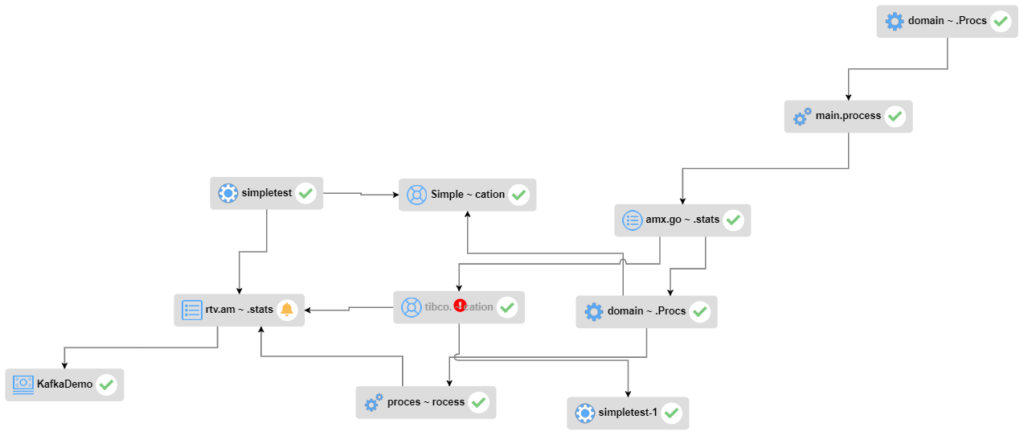
With RTView Enterprise, users can visualize complex application flows of individual services to identify potential problems. Diagram creation and maintenance are automated so they are quick to deploy and easy to maintain.
Users can easily apply different topology layouts and change formatting options, as well as manually change flows and element locations within the diagram.
7. Provide Your End users with Custom Displays
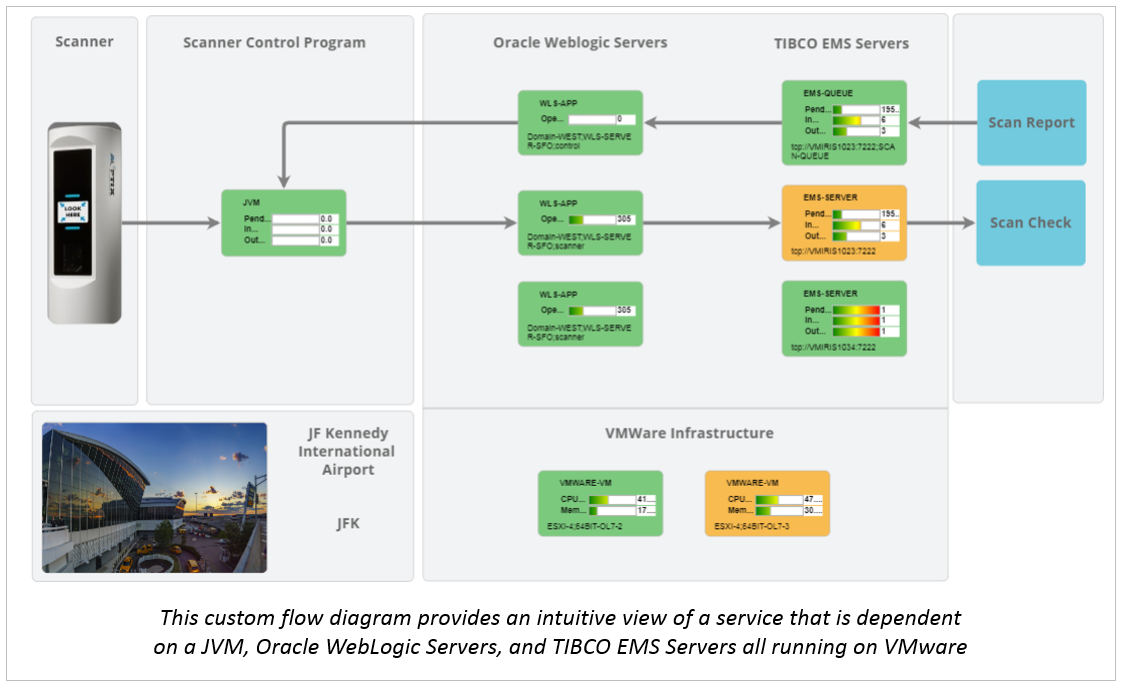 Support teams and admins are often asked to provide information to other classes of users, including business users and app owners.
RTView Enterprise includes easy-to-use tools for custom display development so you can provide your end users with the information they care about via self-service.


