The latest release of RTView® Enterprise includes several new user experience enhancements for alerting, security, and visualization. These are featured updates, not a complete update list. For the complete list, please read the Release Notes.
Platform Enhancements
New Custom Display Designer
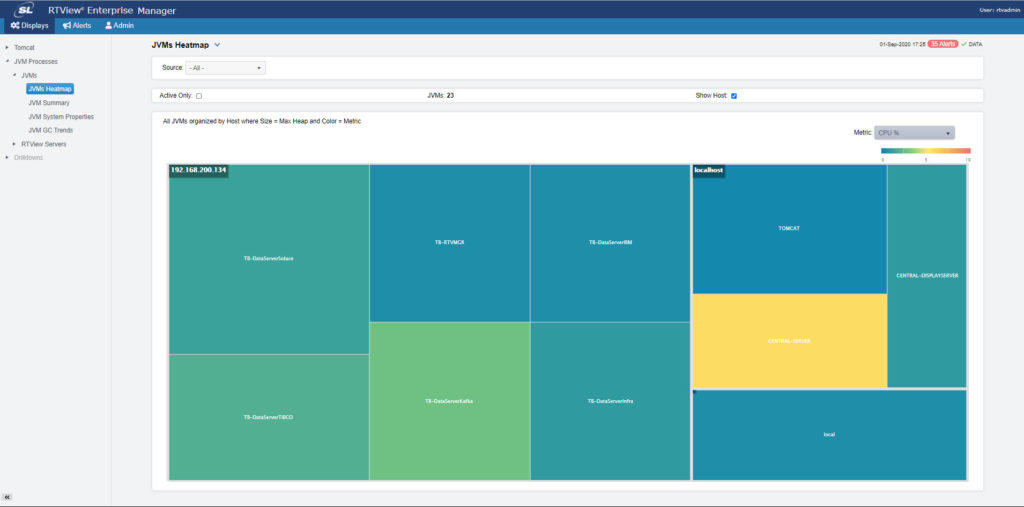
RTView Enterprise has been enhanced to include the Custom Display Designer (CDD). The CDD enables administrators to quickly create and publish displays for users requiring tailored views of critical application and business service performance.
New Custom Display Designer
RTView Enterprise has been enhanced to include the Custom Display Designer (CDD). The CDD enables administrators to quickly create and publish displays for users requiring tailored views of critical application and business service performance.
Application Data Flow Diagrams
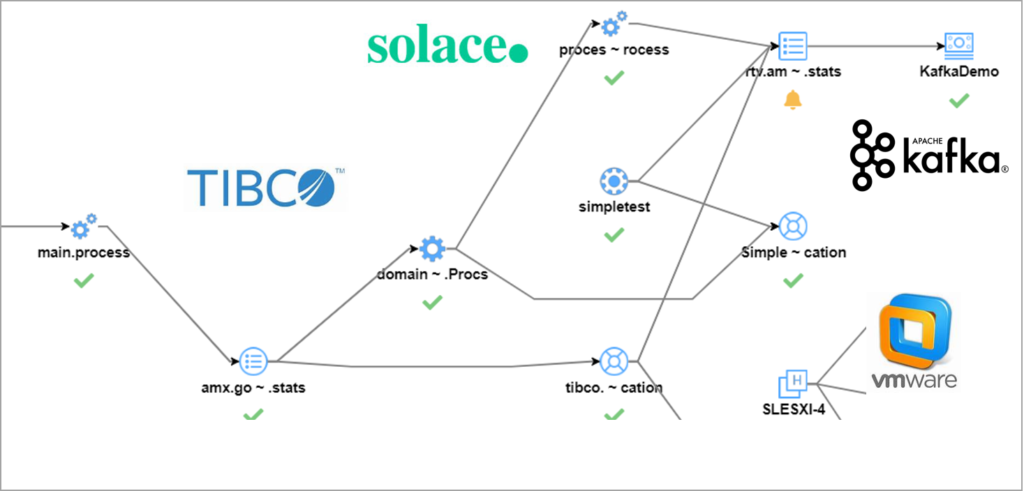
RTView Enterprise has been enhanced with application data flow diagrams. This feature allows application owners and support teams to visualize complex applications data flows, zoom in to identify trouble spots and take remedial action.
Custom Alerts
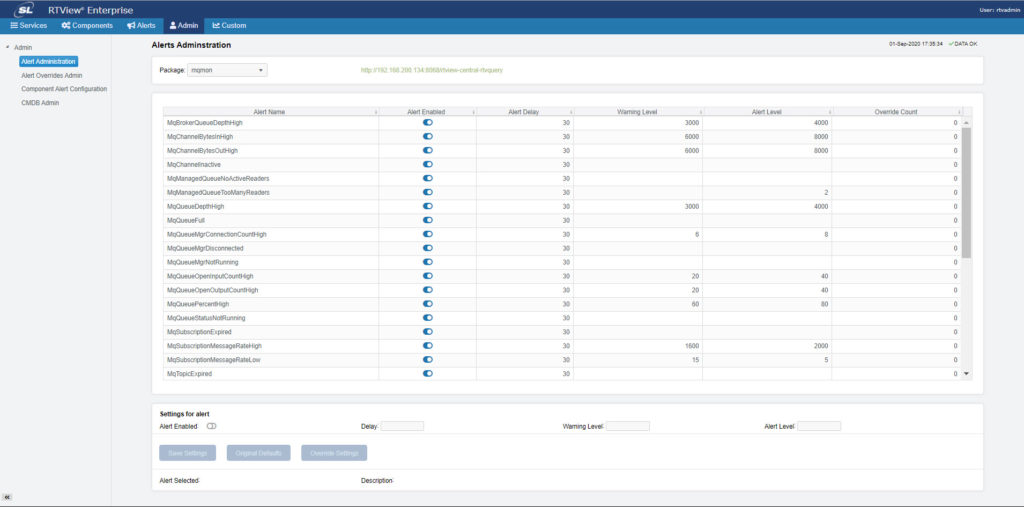
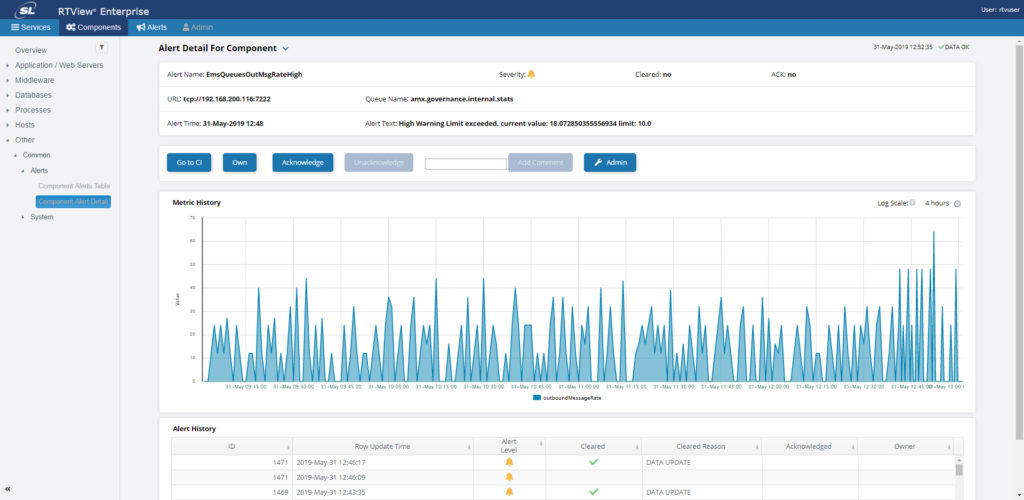
Provides support for defining custom alerts against any monitored metric. Once deployed, these alerts will behave like the built-in alerts with the ability to configure thresholds and duration in the Alert Administration page.
Custom Alerts
Provides support for defining custom alerts against any monitored metric. Once deployed, these alerts will behave like the built-in alerts with the ability to configure thresholds and duration in the Alert Administration page.
Alert Overrides
The Alert Overrides Admin display now allows multiple selections to create, edit, or remove overrides to several alerts at the same time.
The display now contains a pattern/RegEx filter to manage the contents of the table so that a pattern or RegEx can be designed to search on all the index columns at once.
Grafana Plug-in
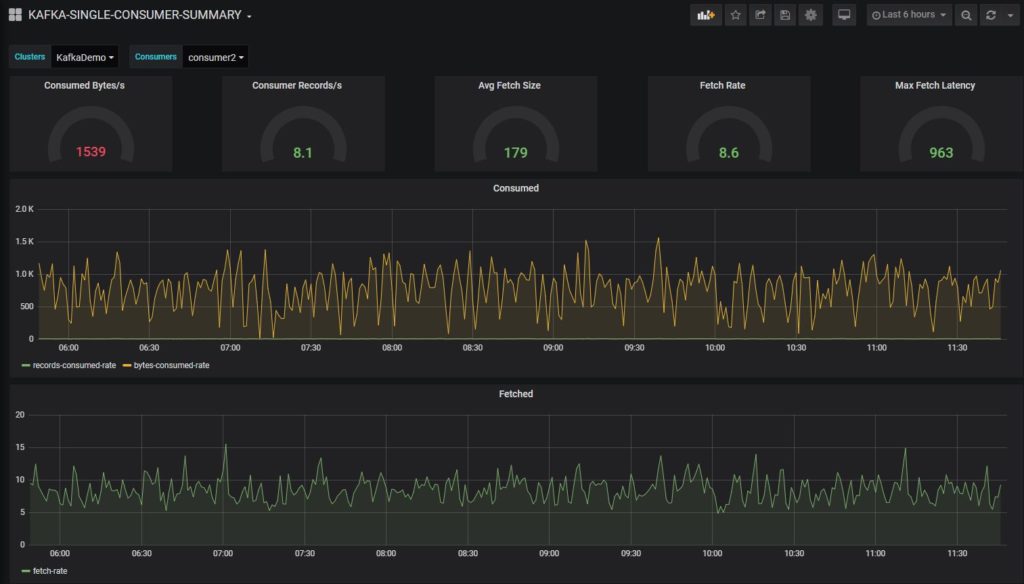
Grafana developers are able to create custom dashboards connected to RTView DataServers with the RTView Grafana plug-in.

Grafana Plug-in
Grafana developers are able to create custom dashboards connected to RTView DataServers with the RTView Grafana plug-in.
Simplified Security Configuration
Enhanced support for LDAP with three-step configuration.
RTView DataServers support secure socket connections (SSL) without certificates. This is now configured via graphical interface.
Solace Monitoring Enhancements
- Quickly create and deploy personalized views of key metrics with the new Custom Display Designer.
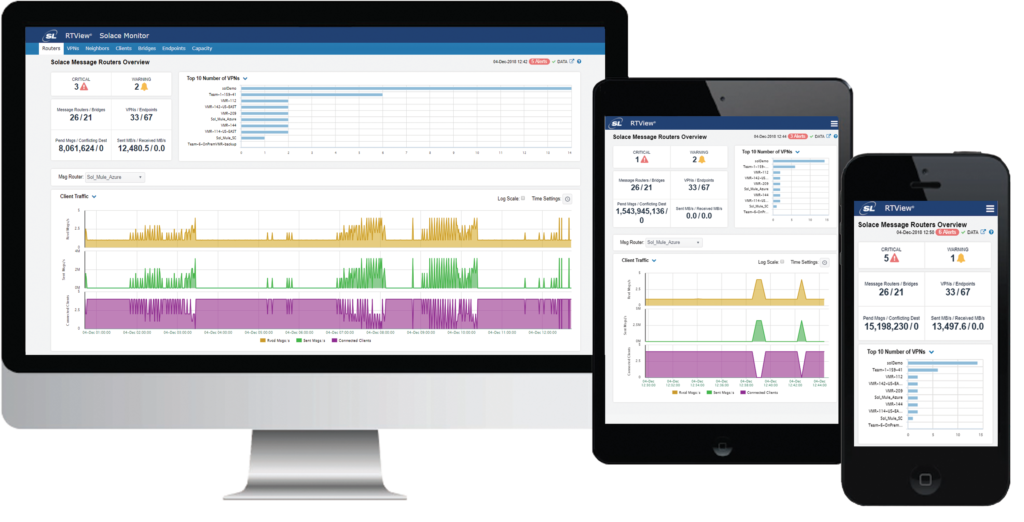
- Keep on top of what matters most with user defined custom alerts that can be created on any metric in PubSub+ Monitor.
- Simplified setup, configuration and evolution of alert overrides at a more granular level.
- SEMP Schemas are now automatically uploaded from brokers
- Improved topology views for bridges and neighbors provide better visibility of the Solace estate and visible alerts
- Simplified LDAP and security configuration
Kafka Monitoring Enhancements
Autodiscovery of Kafka Brokers in a Cluster
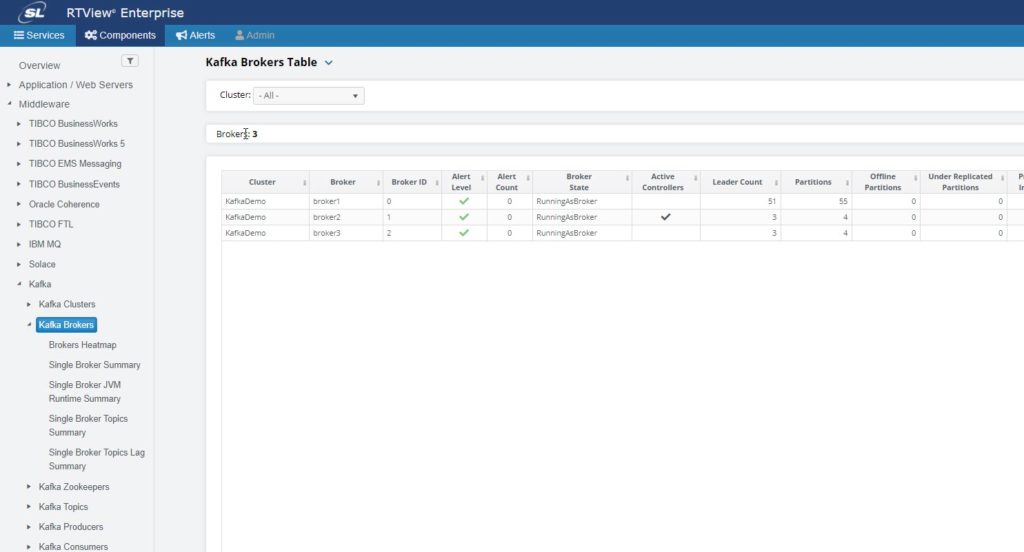
RTView will discover the Brokers in a cluster by querying the Zookeeper and will automatically make connections to their JMX and client ports.
Autodiscovery of Kafka Brokers in a Cluster
RTView will discover the Brokers in a cluster by querying the Zookeeper and will automatically make connections to their JMX and client ports.
New Kafka Topic Displays with Time Intervals
There are two new displays in the Topics section,
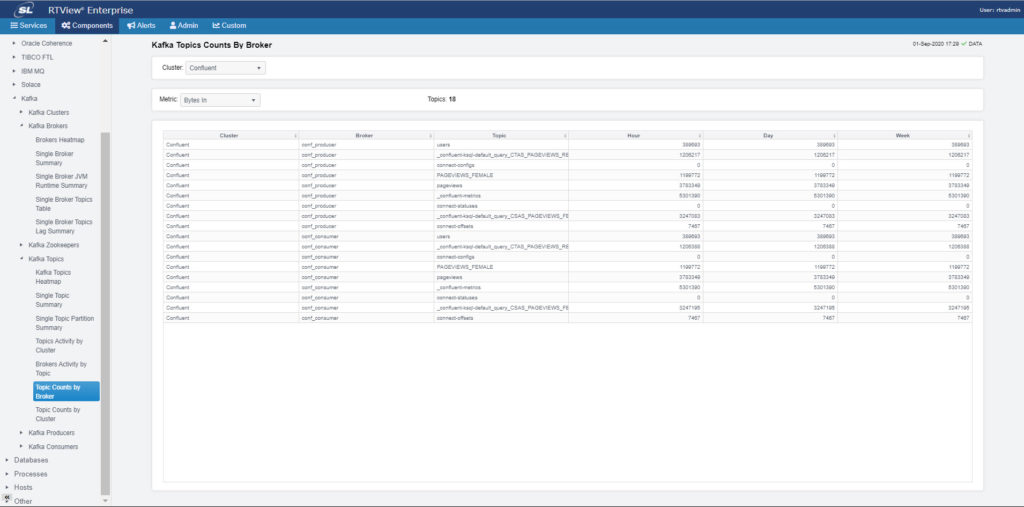
Kafka Topic Counts by Broker and Kafka Topic Counts by Cluster that show any one of the three metrics across hour, day and week periods. The first is per topic and per broker and the second is per topic and summed across the brokers.
IBM MQ Monitoring Enhancements
Queue Manager Level Alerts on IBM MQ
All IBM MQ Queue alerts have now a new index containing the name of its Queue Manager, which can be used to define alert overrides by this column. Queue Manager names no longer contain spaces.
Queue Manager Level Alerts on IBM MQ
All IBM MQ Queue alerts have now a new index containing the name of its Queue Manager, which can be used to define alert overrides by this column. Queue Manager names no longer contain spaces.


