Have you ever found the perfect solution to your problem – and then be told that you can’t use that solution because YOUR company uses a DIFFERENT solution? One that doesn’t address YOUR particular problem?
We hear that a lot. And it makes us SAD to know that we could solve your problem if it weren’t for this mandate to only use the same tools that everybody else is using within the company.
RTView is Bringing TIBCO Middleware Monitoring to Splunk
Well, we love solving problems so much that we decided to tackle this very problem – with our new partner, Splunk! That’s right. SL is now collaborating with Splunk to fill in the middleware blindspots that so many companies struggle with.
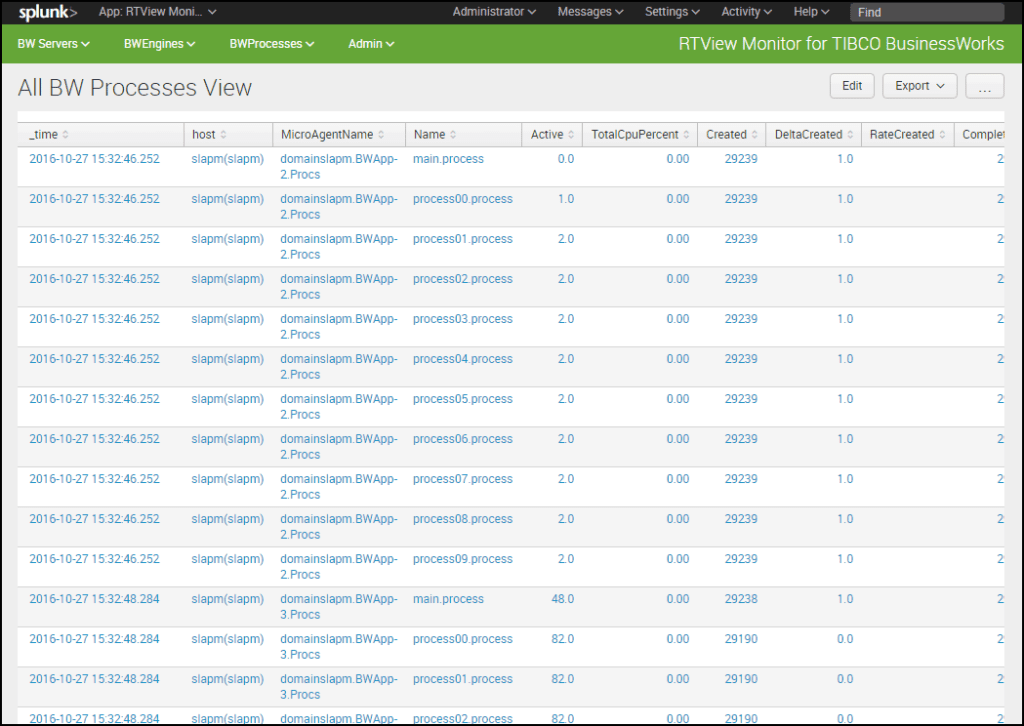
Now SL is providing a packaged offering to bring real-time middleware performance metrics into the Splunk UI – starting with TIBCO BusinessWorks. You can deploy the RTView data server for TIBCO BusinessWorks in your environment, and connect it to our sample TIBCO BusinessWorks displays in Splunk. Now any Splunk user can view performance and availability data for TIBCO BusinessWorks inside of Splunk.
This is the first, fully-supported TIBCO BusinessWorks integration with Splunk. SL has been a TIBCO Partner since 2002, and we have lots of experience working with TIBCO BW customers. The initial distribution of this integration is via GitHub @ www.github.com/slcorp and we will soon be offering the same on Splunkbase.
Why integrate RTView BusinessWorks Monitoring capabilities with Splunk?
- TIBCO Monitoring is a blindspot for Splunk users. If you can’t see the resource performance and availability of TIBCO BusinessWorks servers, engines, and processes – then you cannot be proactive. And nobody WANTS to wait around for something to break before taking action.
- The RTView BW Monitor for Splunk is supported. You don’t have to create your own homegrown adapter or rely on a 3rd party person who only does support outside of their day job. You can count on SL and RTView
- Real-time resource monitoring data from RTView is so much richer than standard log files. Log files are useful to writing our exceptions, but not so much when it comes to real-time streaming performance and availability updates.
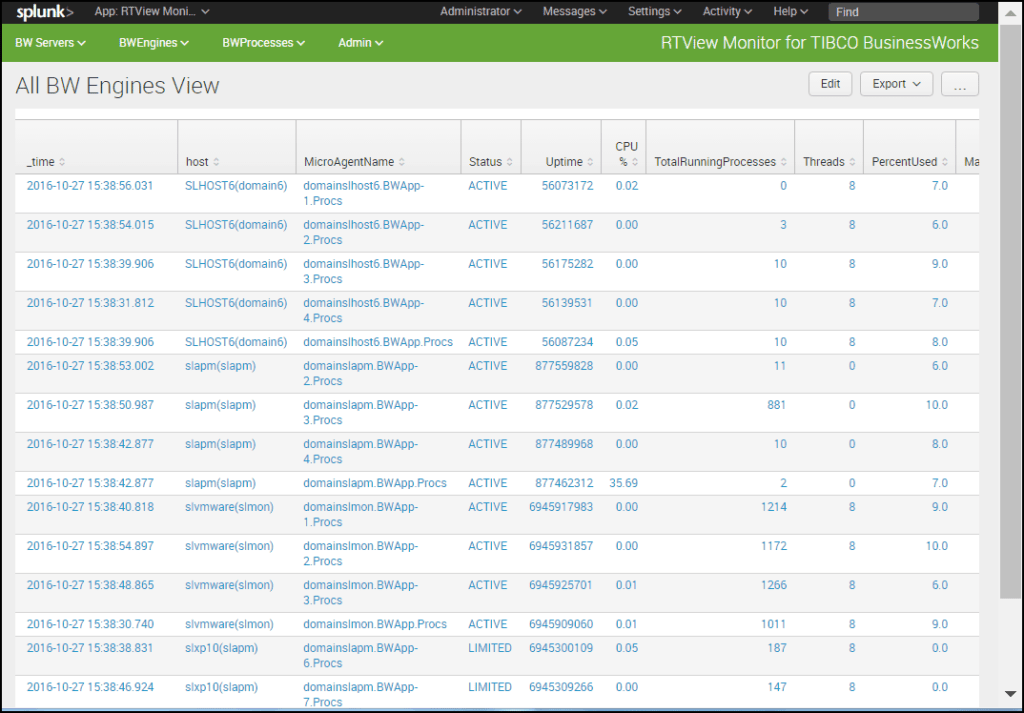
- RTView BW Monitor for Splunk correlates BW servers, engines and processes with the host it is running on. Quickly match up an underperforming instance with CPU and memory shortages for quick troubleshooting.
- Share BW monitoring data across support teams. Data silos to not support collaboration but ensuring that the right info is available across all your platforms allows your different support teams to work together to spot emerging problems and fix them BEFORE it’s too late.
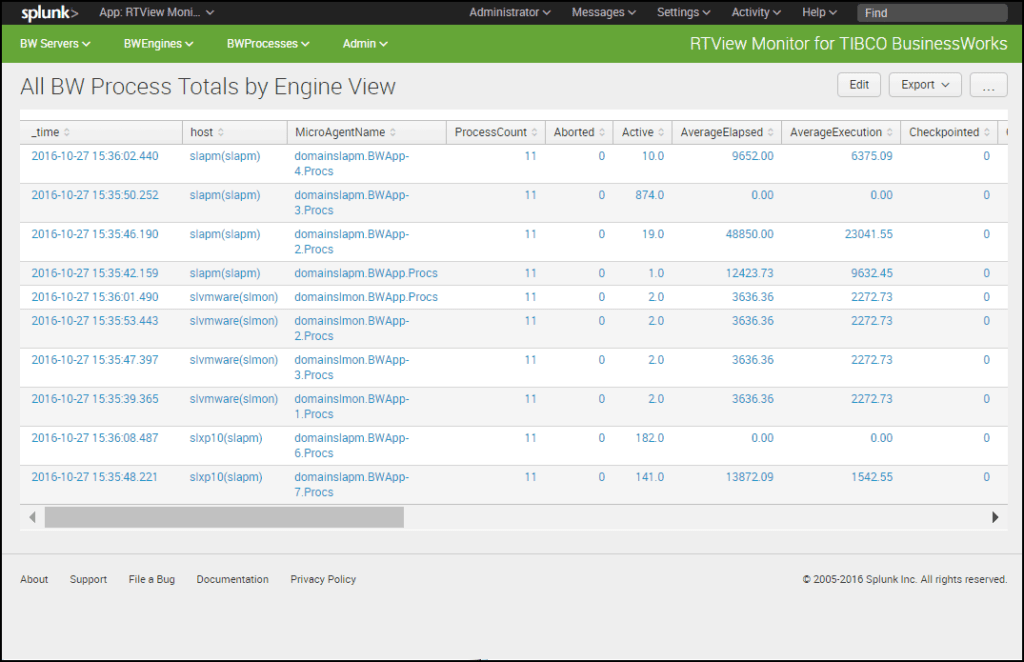
- Get up and running quickly with our sample templates. These UIs were built using Splunk tools so that you don’t have to build displays from scratch. However, Splunk developers can easily customize and extend these displays to meet their own requirements.
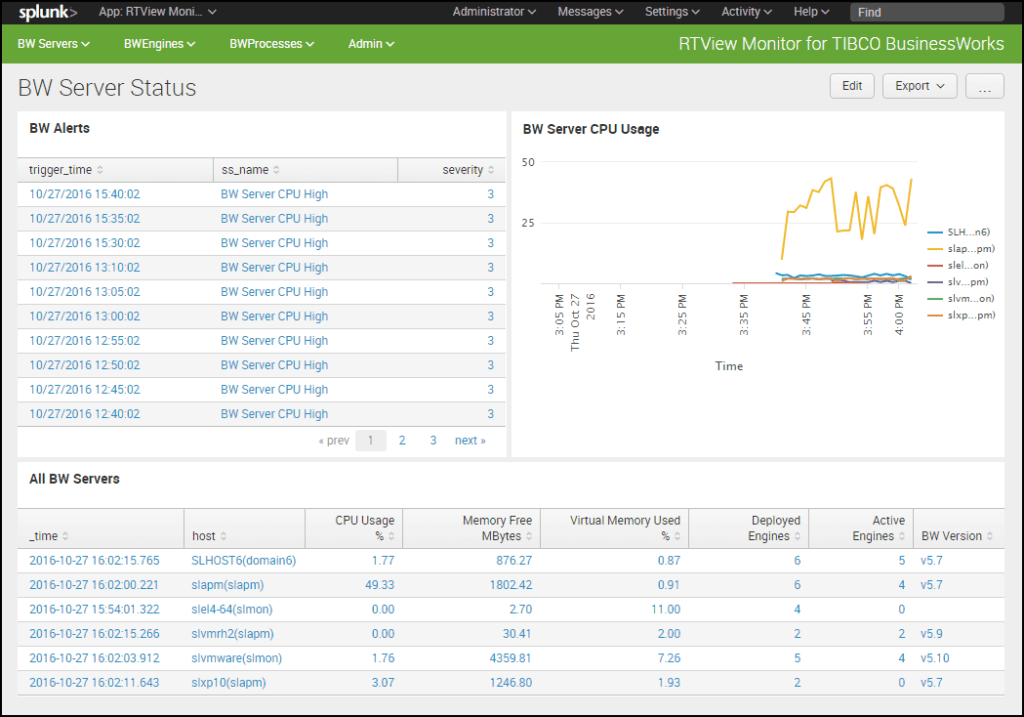
See all BW servers together, identify those with performance issues and correlate those serves with underlying physical resources like memory, CPU, etc…
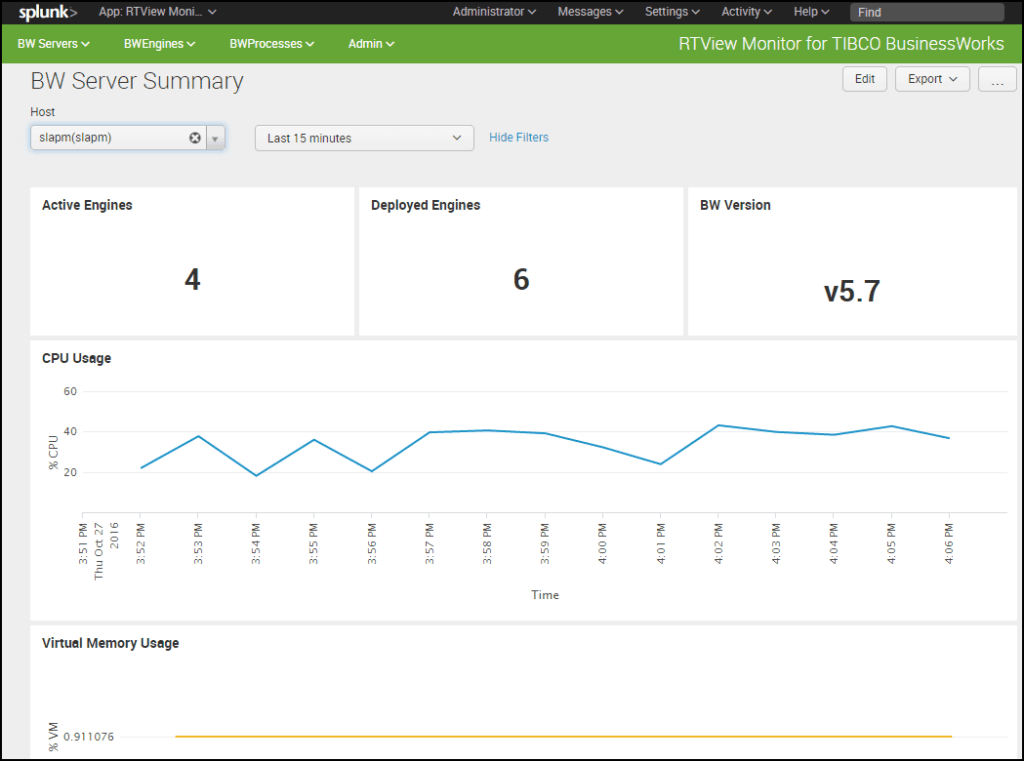
Access historical data for BW server, engine and process performance to identify spikes and trends and aid in root cause analysis.


