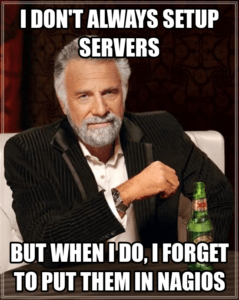
 As the owner of a critical application on which your business depends, how many times have you heard something like “Oops, we forgot to set up monitoring on that server?” Usually this is heard a short while after the application has crashed and shut out all your customers. The outage most likely was due to some simple issue like an out of memory error on a newly installed server that could easily have been prevented had it been properly monitored.
For many companies today, Information Technology is seen as a key competitive advantage. That technological “edge” can be enhanced by being agile and responding quickly to market demands. Often this translates to upgrading or extending critical (and typically complex) applications on a regular basis … a practice which can introduce significant risk.
Once a software system is properly tested and works adequately, it usually keeps working. But once even the smallest change is made to a complex integrated system, there is a danger that some new setting is set too low, or a miscalculation puts an important subsystem under new and greater load. The results are often disastrous for the business.
Is there a way to prevent such disasters ?
The simple answer of course is to monitor the applications effectively … but this is easier said than done. There are hundreds of monitoring tools out there that you can choose from (and thousands of home-grown versions). By any estimate, the vast majority of users are not satisfied with the results they are able to achieve.
The crux of the problem is in dealing with changes that occur in these complex business applications on a regular basis. Traditional monitoring systems typically provide some form of “auto-discovery”, i.e automatically becoming aware that a new component has been added to the system. The problem is in what to do with that new component once it is discovered. Usually, monitoring must be “turned on” manually either by adding a new alert “rule” or adding the new component to a list to be monitored.
But this approach can be dangerous … it is all too easy to simply forget to do it. Forget to create that new Alert Rule, for example, and the system comes up without being monitored for a simple thing like memory utilization. A few days later, the new component has a problem, the application goes down, and a frantic search for the cause begins.
Having seen this problem rear its ugly head time and again, we addressed it in RTView by making the alert system operate in a more automated fashion. By default, alert rules are applied to tabular data, such as the auto-discovered lists of components. Every component of a particular type can be monitored without requiring manual configuration; a global setting is applied by default so that all new components get a default level of monitoring. An individual component can have its specific threshold overridden and set to a value that is appropriate for its usage pattern.
This tabular approach to alert rule configuration is but one example of a data-driven approach to software configuration. The combination of the default rules and the override settings for individual components is a configuration table which itself can be created by an automated calculation that takes factors such as historical averages into account.
The keyword here is automation. Monitoring software solutions have evolved in their sophistication to a level that is on par with even the most complex business applications that they are deployed to monitor. Automation of key features such as alert configuration is an essential characteristic of a modern monitoring solution.


